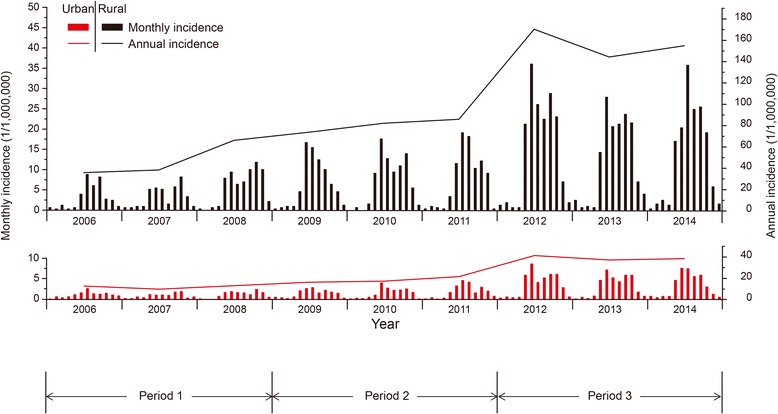
Fig. 3.

Temporal distribution of monthly scrub typhus incidence for rural and urban areas separately. The bar charts in black and red represent the monthly incidence in rural and urban areas, and the black and red line represents the annual incidence of the scrub typhus in rural and urban areas in Guangzhou, 2006―2014
