
Fig. 1.
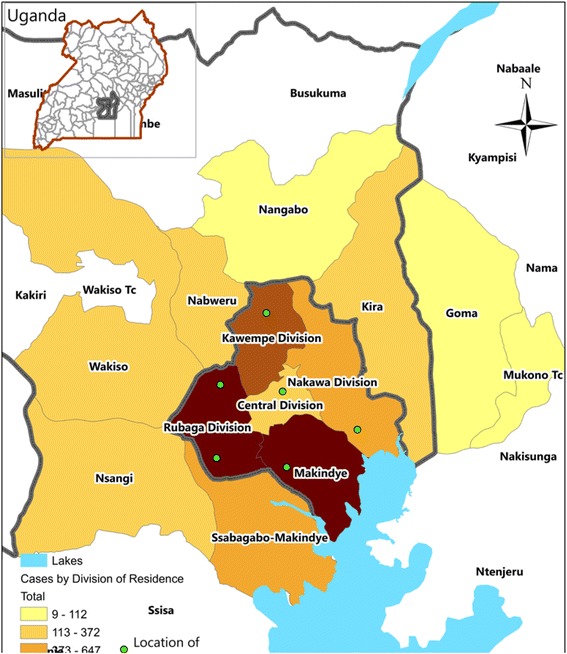
An intensity map showing treatment centers (green dots) and geographical distribution of suspected case-patients by place of residence during an outbreak of typhoid fever: Kampala, Uganda, 17th February 2015 – 14th April 2015 (n = 9325)
Official websites use .gov
A
.gov website belongs to an official
government organization in the United States.
Secure .gov websites use HTTPS
A lock (
) or https:// means you've safely
connected to the .gov website. Share sensitive
information only on official, secure websites.
An intensity map showing treatment centers (green dots) and geographical distribution of suspected case-patients by place of residence during an outbreak of typhoid fever: Kampala, Uganda, 17th February 2015 – 14th April 2015 (n = 9325)