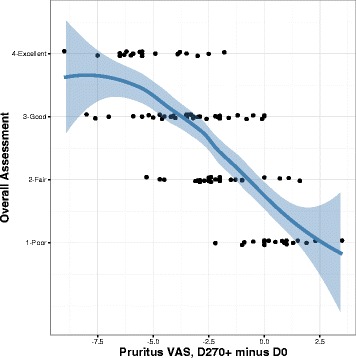
Fig. 3.

Effectiveness of regionally-specific immunotherapy in dogs versus change in pruritus severity. The change in the PVAS equals the PVAS at D270+ minus the PVAS at D0. The line is a locally weighted scatterplot smoother with the shaded area showing the 95% confidence interval around the point-wise mean
