Fig. 1.

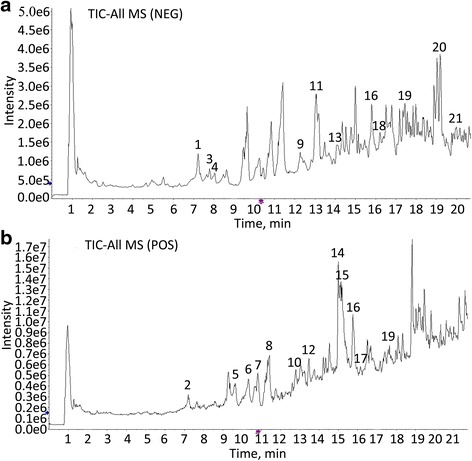
HPLC-ESI/MSn total ion chromatograms of XFHM processed by different methods. a The negative base peak MS spectrum, b the positive base peak MS spectrum

HPLC-ESI/MSn total ion chromatograms of XFHM processed by different methods. a The negative base peak MS spectrum, b the positive base peak MS spectrum