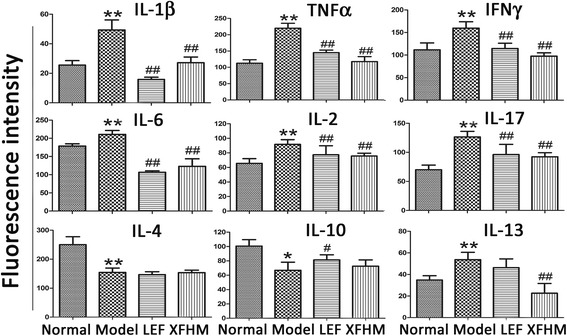
Fig. 6.

The levels of pro-inflammatory and anti-inflammatory cytokines in serum detected by inflammation antibody array assay. Data are presented as the means ± S.D. (n = 6). * P < 0.05 and ** P < 0.01 indicate model group vs. normal group; # P < 0.05 and ## P < 0.01 indicate treatment groups vs. model group
