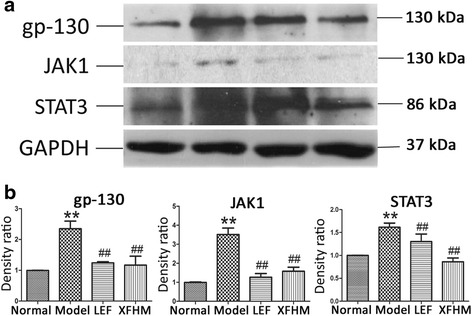
Fig. 8.

Effect of XFHM on inhibiting activation of the JAK/STAT signaling pathway. a and b gp130, JAK1 and STAT3 were detected in whole spleen tissue lysates by western-blot analysis. The quantified results are indicated by a bar chart. GAPDH was used as an internal control. GAPDH was used as an internal control. Data are presented as the means ± S.D. (n = 6). ** P < 0.01 indicates model group vs. normal group; # P < 0.01 and ## P < 0.01 indicate treatment groups vs. model group
