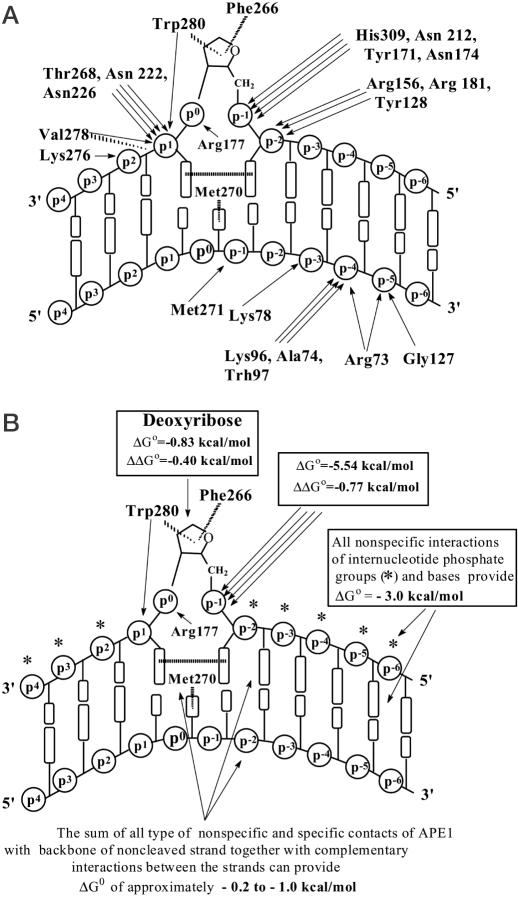
Figure 6.
(A) Schematic representation of contacts between APE1 and specific ds DNA revealed by X-ray crystallography (3,15). Arrows indicate interactions between the various amino acid residues and structural elements of DNA, assisting the sharp DNA kinking (see text for details). (B) Thermodynamic model of APE1 interactions with specific DNA, displaying ΔG° values characterizing different contacts and strengthening of some contacts in comparison with nonspecific DNA (see Figure 5). The total ΔΔG° value characterizing a change in all types of interactions upon transition from nonspecific to specific DNA can be estimated at −1.1 to −1.5 kcal/mol.

