Figure 4.
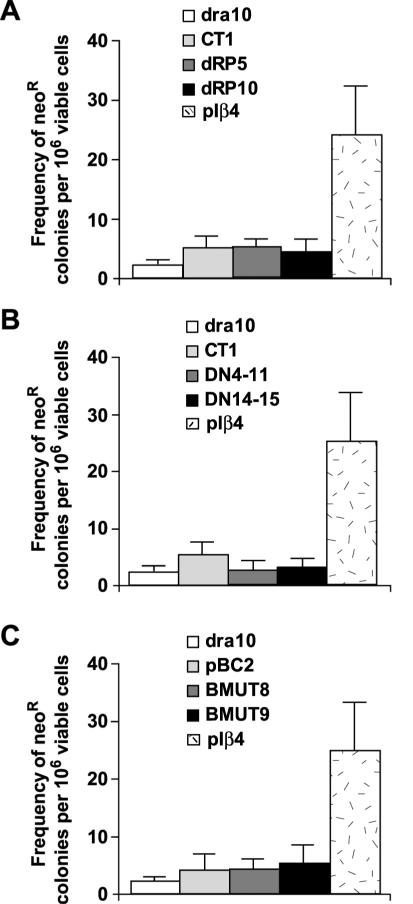
Effect of the expression of the different forms of polβ on recombination frequency. (A) Frequency of neoR events in control cell line (DRA10), cells expressing pIRES empty vector (CT1) and in cell lines expressing the 8 kDa domain (dRP) (dRP5 and dRP10) compared with the polβ overexpressing cell line (pIβ4). Results are the mean values ± SD of three independent experiments. No significant difference between values for DRA10 cells and CT1 and dRP5 and dRP10 cells was observed, P > 0.05 as determined by Student's t-test. (B) Frequency of neoR events in control cell line (DRA10), cells expressing pIRES empty vector (CT1) and in cell lines expressing the 14 kDa domain of polβ (DN14-11) and (DN14-15) compared with the polβ overexpressing cell line (pIβ4). Results are the mean values ± SD of three independent experiments. No significant difference between values for DRA10 cells and DN14-11 and DN14-15 cells was observed, P > 0.05 as determined by Student's t-test. (C) Frequency of neoR events in control cell line (DRA10), cell lines expressing the pBLAST empty vector (pBC2) and in cell lines expressing the mutated form of polβ (BMUT8) and (BMUT9) compared with the polβ overexpressing cell line (pIβ4). Results are the mean values ± SD of three independent experiments. No significant difference between values for DRA10 cells and pBC2, BMUT8 and BMUT9 cells was observed, P > 0.05 as determined by Student's t-test.

