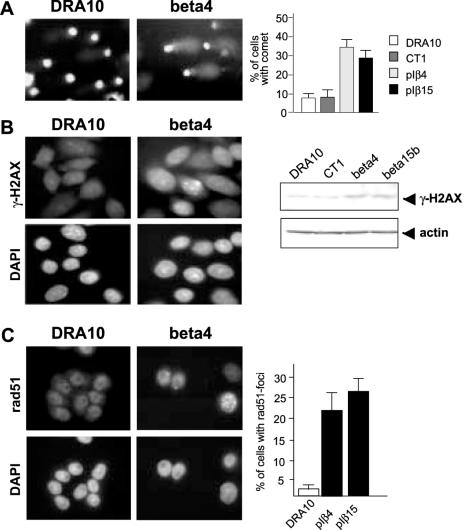
Figure 5.
Evaluation of DNA strand breaks and Rad51 foci formation. (A) Detection of DNA strand breaks was performed by SCGE (COMET assay). Slides from two independent experiments were examined, and in each experiment at least 50 cells were observed. Values are the mean values ± SD of two independent experiments. (B) Immunofluorescence detection and western blot analysis of γ-H2AX expression to detect DNA DSBs. (C) Immunofluorescence detection and quantification of the cells displaying Rad51 foci in the different cell populations. Values are the mean values ± SD of three independent experiments. For each experiment, 100 cells were examined.

