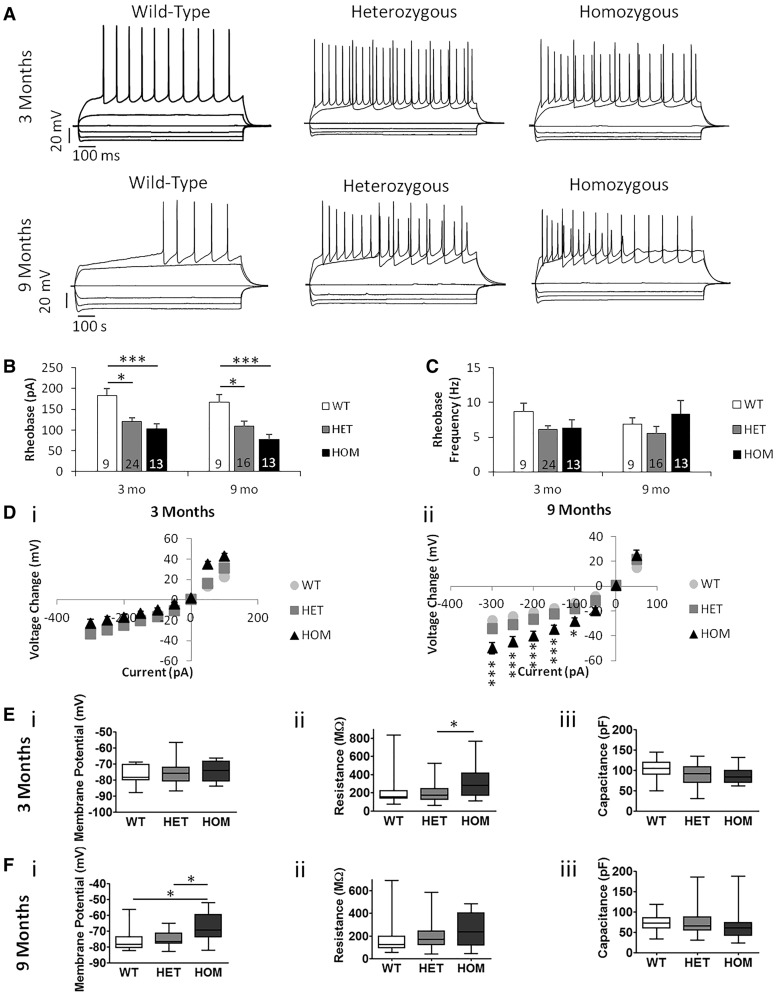
Figure 10.
Q175FDN mice have more excitable MSNs. (A) Examples of I/V curve recordings from Q175FDN mice at 3 months and 9 months of age. At 3 months n = 6 WT, 5 HET, 4 HOM mice. At 9 months n = 5 WT, 5 HET, 4 HOM mice. Number of cells indicated on figure columns. (B) Rheobase. There was a significant effect of genotype on the rheobase at 3 (P = 0.0005) and 9 months (P = 0.0007). WT mice had a higher rheobase than HET and HOM at both 3 (P < 0.05, P < 0.001) and 9 months (P < 0.05, P < 0.001). There was no difference between HET and HOM at either age (P > 0.05). (C) Rheobase frequency. There was no difference between genotypes at 3 (P > 0.05) or 9 months (P > 0.05). (D) I/V curve. i) At 3 months there was a significant interaction between genotype and input current (*P = 0.0124) and of input current (P < 0.0001). There was no significant difference between genotypes at any specific input current (P > 0.05). ii) At 9 months there was a significant interaction of genotype and input current (P < 0.0001), and significant effects of genotype (P < 0.0001) and input current (P < 0.0001). The voltage of HOM mice changed more than WT and HET mice at − 300 pA (P < 0.001), −250 pA (P < 0.001), −200 pA (P < 0.001), −150 pA (P < 0.001) and −100 pA (P < 0.05) inclusive.

