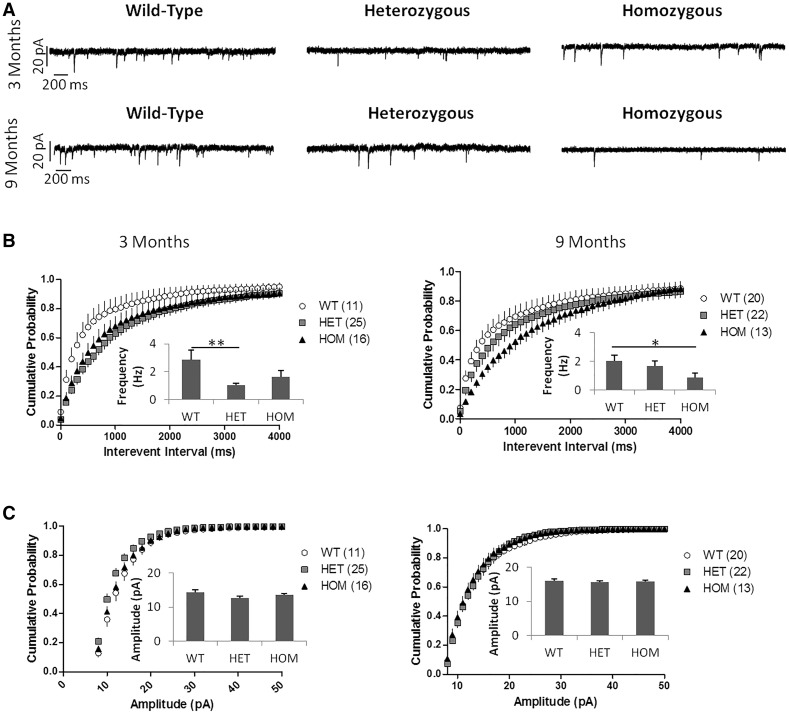
Figure 11.
Q175 MSNs show decreased sEPSC frequency. (A) Example sEPSC recordings from Q175FDN mice at 3 and 9 months of age. At 3 months n = 6 WT, 5 HET, 4 HOM mice. At 9 months n = 5 WT, 5 HET, 4 HOM mice. Number of cells indicated next to genotype in figure legend. (B) sEPSC frequency cumulative probability and mean (inset). At 3 months there was a significant difference between groups (P = 0.0045). HET SPNs had lower sEPSC frequency than WT SPNs (P < 0.01). There was no difference between WT and HOM or between HET and HOM SPNs (P > 0.05). At 9 months there was also a significant difference between groups (P = 0.0279). HOM SPNs had lower sEPSC frequency at than WT SPNs (P < 0.05). There was no difference between WT and HET or between HET and HOM SPNs (P > 0.05). (C) sEPSC amplitude cumulative probability and mean (inset). There was no difference in sEPSC amplitude at 3 or 9 months of age. All mice shown were male. There was a significant effect of genotype and interevent interval on interevent interval cumulative probability at both 3 and 9 months (P < 0.0001 for both effects at both ages). There was no significant interaction of genotype and interevent interval at either age (P > 0.05) All data analysed using one- and two-way repeated measures ANOVAs with Bonferroni post hoc tests. * P < 0.05, ** P < 0.01.

