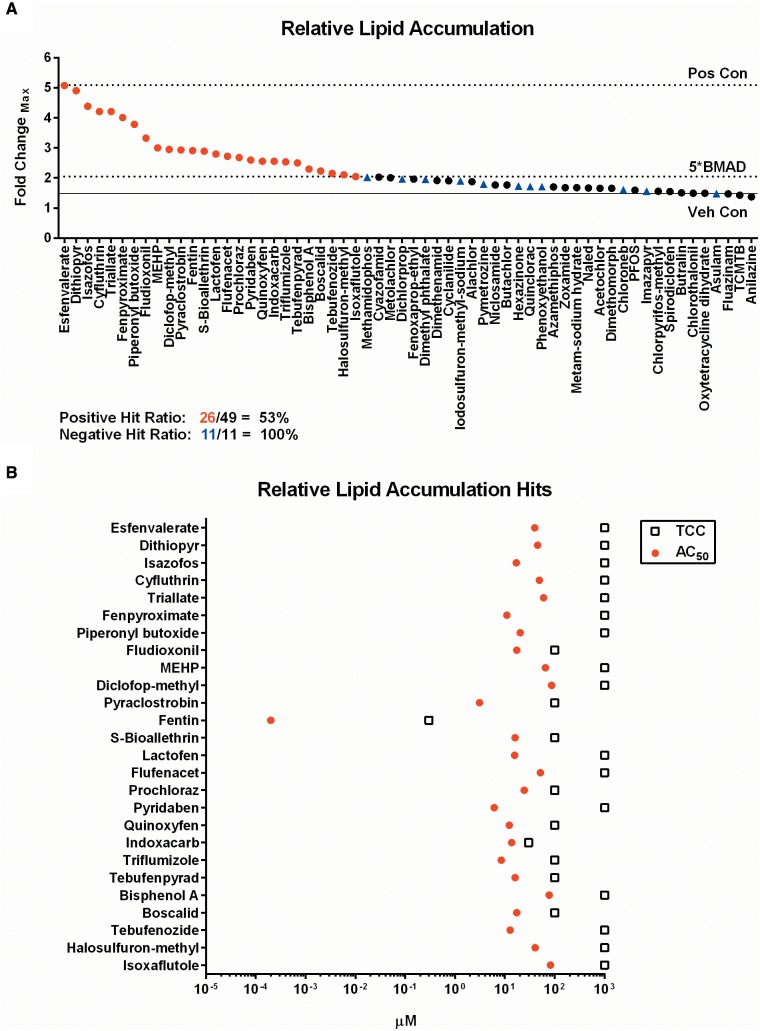
FIG. 3.
Primary adipogenesis screening results. Sixty chemicals screened in the adipogenesis assay were scored for significance and plotted as rank-ordered (left-to-right) maximum fold-change observed for any concentration point in the viable range of each chemical (A). The corresponding AC50 values and cytotoxicity derived TCC are plotted for each hit identified (B). Red circles are PPARG candidate chemical hits, black circles are non-significant PPARG candidate chemical hits, and blue triangles are negative controls. Pos Con = rosiglitazone positive control, Veh Con = DMSO vehicle control, 5*BMAD = significance threshold cutoff, TCC = toxicity concentration cutoff.

