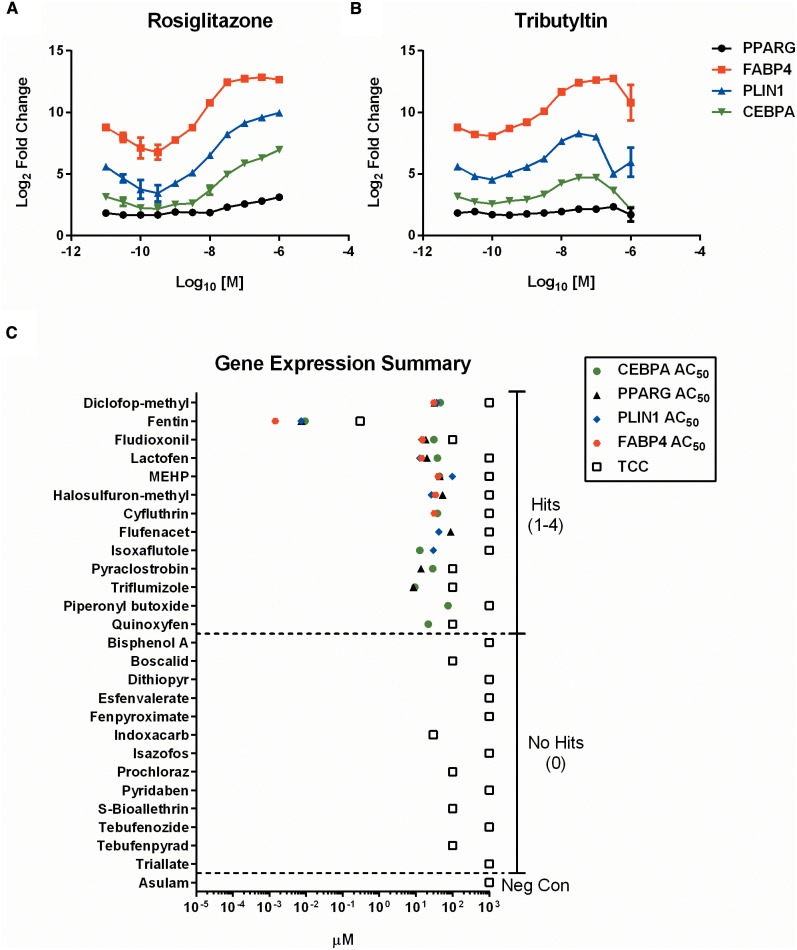
FIG. 5.
Multiplexed gene expression results. CEBPA, PPARG, PLIN1, and FABP4 mRNA expression are plotted as Log2 ratios of treated versus DMSO vehicle controls for rosiglitazone (A) and tributyltin (B). Each gene endpoint was scored independently and comprehensive AC50 and TCC values plotted for each chemical (C). Dashed lines separate regions of hit frequency (0–4), with activity of negative control (asulam) shown.

