FIG. 6.
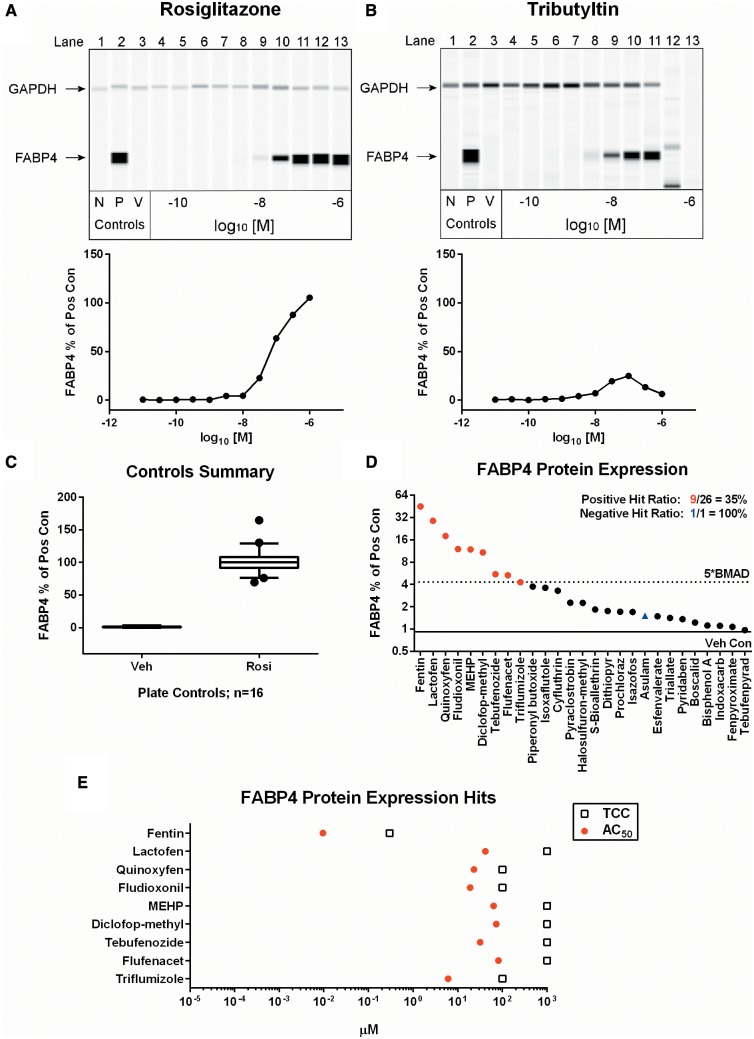
FABP4 protein expression results. Qualitative and quantitative FABP4 and GAPDH protein expression levels are shown in concentration-response format for rosiglitazone (A) and tributyltin (B). Values are representative of 3 experimental replicates. N = non-differentiated controls, P = rosiglitazone positive control, V = DMSO vehicle control. The performance of control values from all plates run in the assay (n = 16) are shown (C). Each box and whisker plot displays the median, first and third quartiles (boxes), and the 2.5–97.5 percentile (whiskers). Results from the chemicals screened in the FABP4 assay were scored for significance and plotted as rank-ordered (left-to-right) maximum percentage of positive control observed for any concentration point in the viable range of each chemical (D). The corresponding AC50 values and TCC are plotted for each hit identified (E).

