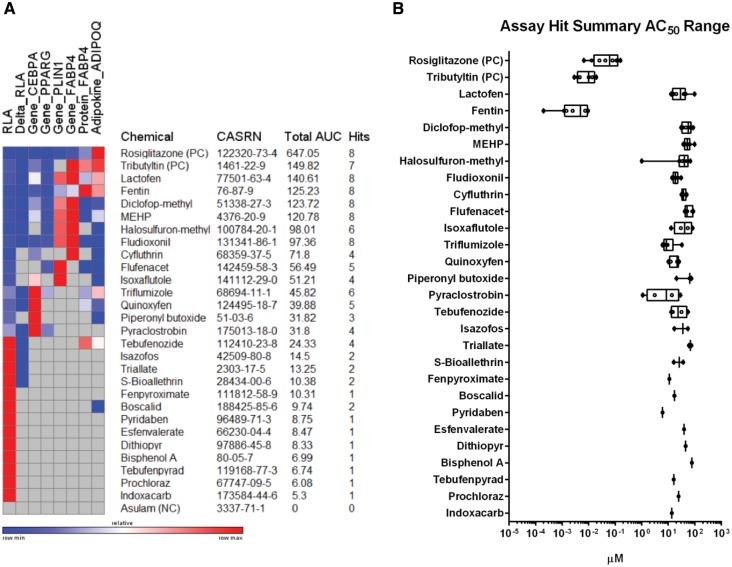
FIG. 8.
Efficacy, hit frequency, and potency summary values for adipogenesis hits. The total peak area under the curve (AUC) of significant hits across 8 assay endpoints was calculated and plotted on a heat map for each of the 26 chemical hits identified in the primary adipogenesis screen. Rosiglitazone and tributyltin positive controls (PC) and asulam negative control (NC) are included for context. Compounds were rank-ordered (top-to-bottom) by total AUC and include CASRN and hit frequency (A). The range of AC50 values for each endpoint hit is displayed for each compound as in part A (B). Each box and whisker plot displays the median, first and third quartiles (boxes), and the min–max (whiskers).

