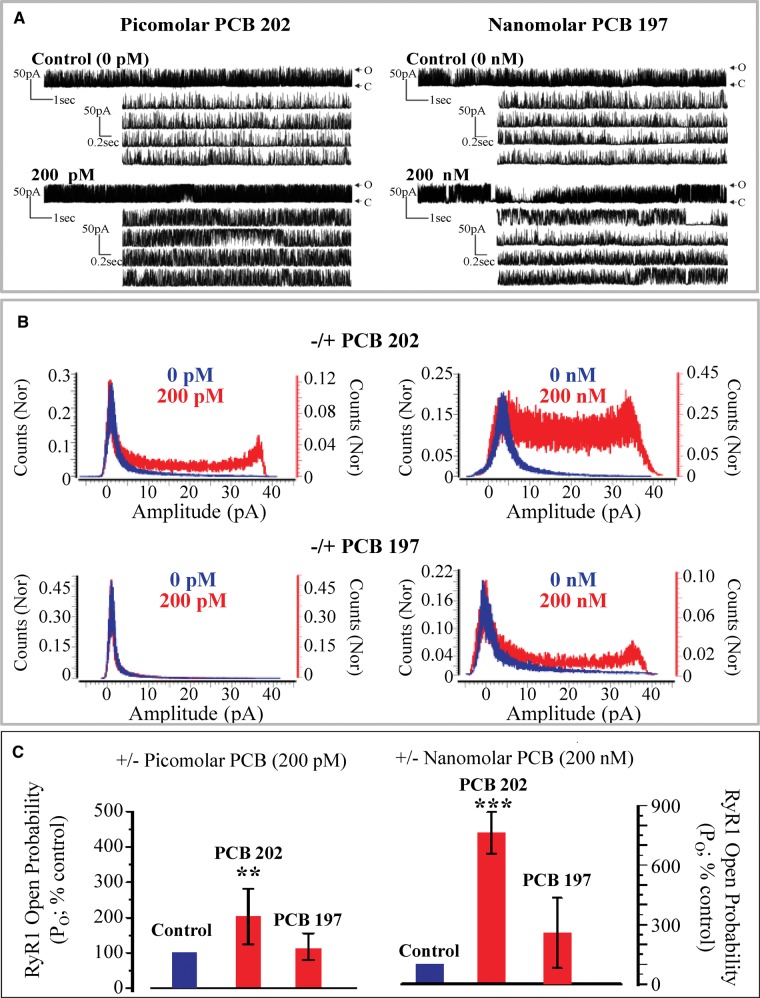
FIG. 4.
Comparison of RyR1 channel gating behavior in the presence of PCB 202 or PCB 197 at 200 pM or 200 nM. (A) Representative traces of (PCB 202 and PCB 197 at 200 pM or 200 nM, respectively). Note PCB 202 at 200 nM and PCB 197 at 200 pM traces are not shown for space purposes. Abbreviations: open channel state (O); closed channel state (C). (B) Frequency histograms of the RyR1 channel current amplitudes before (Blue) and after (Red) addition of PCBs. Bin width 0.1 pA, Y-axis are the normalized (Nor) counts relative to number of events. (C) Percent changes in the open probability (Po) of the PCB exposed channel relative to the Po under baseline (control) conditions. Mean ± SD; PCB 202 n = 6; PCB 197 at 200 pM n = 3 and PCB 197 at 200 nM n = 4,***P ≤ .001 relative to baseline (100%) as determined with a paired sample t-test. (Full color version available online).

