
Figure 3.
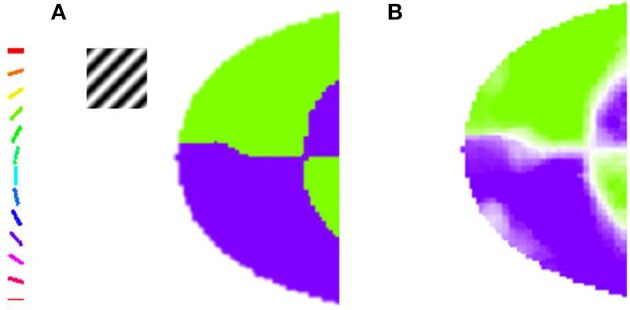
The orientation map developed when the trained LISSOM model is probed with gratings having orientation 45° and 135°, respectively, with varying spatial frequencies. The nodes which respond maximally to one of the orientations are color coded appropriately as shown in the colorbar. These results resemble (Sasaki et al., 2006), where the majority of nodes in the upper half of the output map prefer the 45° orientation, while the nodes in the lower half respond to the 135° orientation stimulus. (A) Orientation Preference of the map developed on probing with gratings of 0.5 cpd; (B) Combined Orientation Preference and Selectivity on probing with gratings of 0.5 cpd.