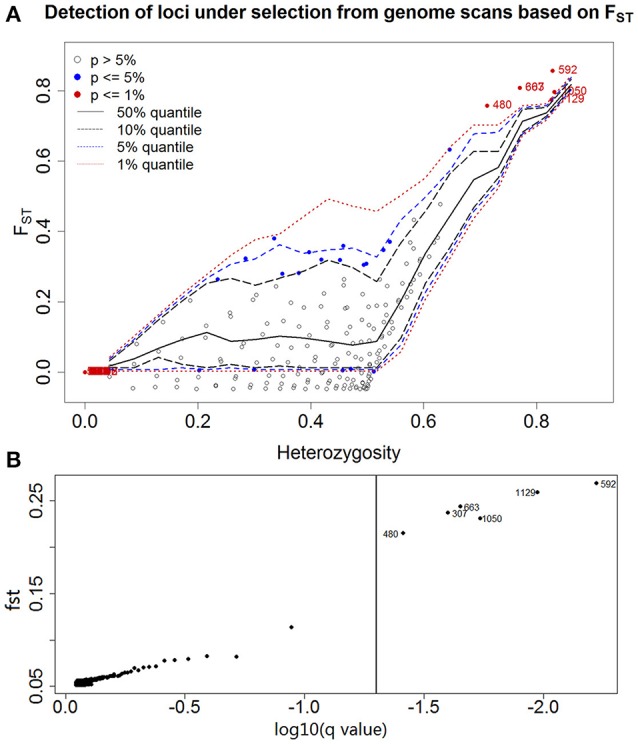
Figure 2.

Genomic scan of P. australis individuals conducted to identify outlier loci between habitats. Each point corresponds to an AFLP marker (N = 1132). (A) A plot of the joint distribution of FST values and heterozygosity generated with Arlequin 3.5 is shown. One-sided confidence interval limits obtained from simulated data are shown as dashed lines. Loci significant at the 5 and 1% levels are shown as filled circles, whereas the numbers of the loci under selection at the 1% level are indicated as 307, 480, 592, 663, 1050, and 1129, although 307 and 663 overlapped. (B) A more rigorous identification conducted with BayeScan 2.1. FST estimates are plotted against the log-transformed q-value, which is the FDR analog of the P-value in the context of multiple testing. With a q-value lower than 5%, the outlier loci are beyond the vertical line, thus providing robust evidence in favor of selection that is considered decisive.
