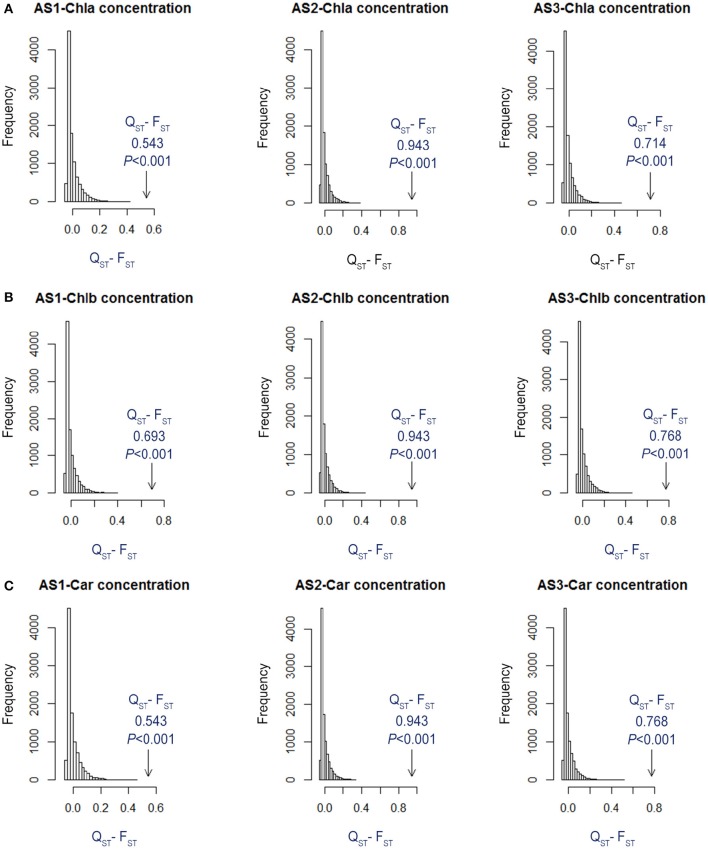
Figure 5.
Simulated distributions of QST-FST for neutrally evolving traits for (A) Chla, (B) Chlb, and (C) Car from the two habitats within each alkali treatment (AS1, AS2, and AS3). The observed values of QST-FST are indicated with arrows, and P-values were calculated from the quantile of the simulated QST-FST distribution that had more extreme values than the observed QST-FST value.

