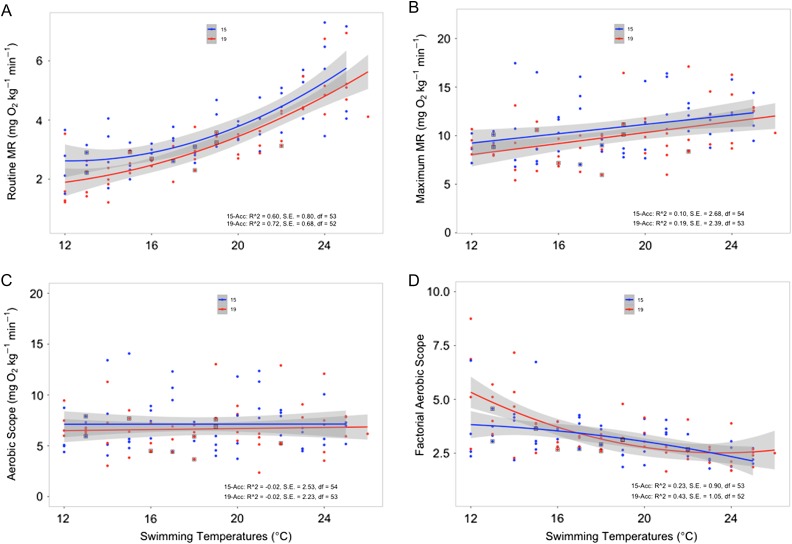
Figure 1:
Thermal performance of hatchery juvenile Chinook salmon acclimated to 15 and 19°C, showing values of resting (routine) metabolic rates (RMRs; A), maximal metabolic rates (MMRs; B), absolute aerobic scope (AAS; C) and factorial aerobic scope (FAS; D). Each point represents one individual fish, and the continuous line represents the best-fitting line for the data; equations for best-fit curves are given in the text. The shaded area surrounding each line represents the standard error of the curve. ‘15-Acc’ and ‘19-Acc’ represent values for 15 and 19°C acclimation groups, respectively. Square boxes around individual data points represent individuals that were bursted to elicit MMR values (square boxes are indicated on RMR values to highlight which individuals required a bursting protocol). There was a significant effect of acclimation temperature on RMR values (P = 0.012), but no significant effect of acclimation temperature on MMR, AAS or FAS values (P > 0.05 for all comparisons). No data from fish that exhibited mortality were used to create the graphs.

