Figure 2.

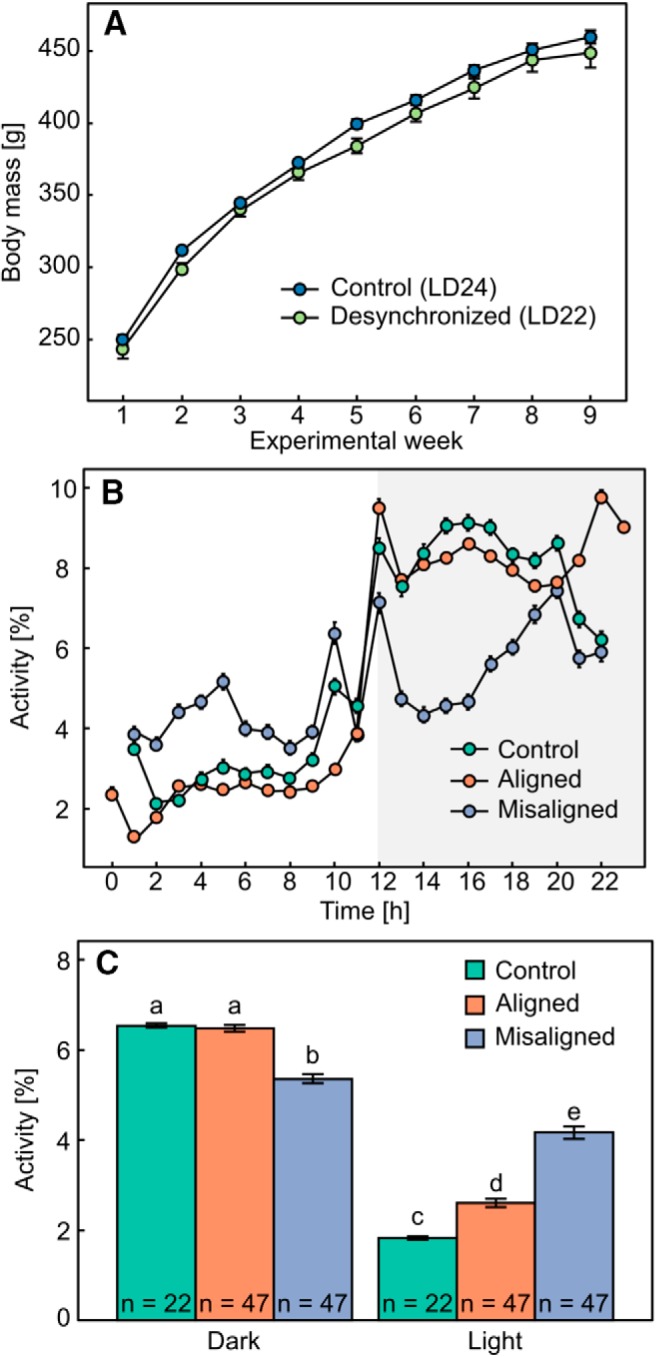
The effect of forced desynchrony on body mass and locomotor activity. A, Change in mean ± SE body mass in LD24 controls (n = 22) and LD22 desynchronized (n = 47) animals throughout the experiment. B, Mean ± SE locomotor activity [% of total activity during each 24- or 22-h cycle] of LD24 control rats and LD22 desynchronized rats. Shaded gray area denotes lights off. Note that data for desynchronized animals corresponds to 11 h of light and 11 h of darkness. C, Mean ± SE locomotor activity per hour (total IR beam interruptions) averaged over either the light or dark phase for control rats, aligned rats, and misaligned rats. Different letters denote statistically significant differences between groups.
