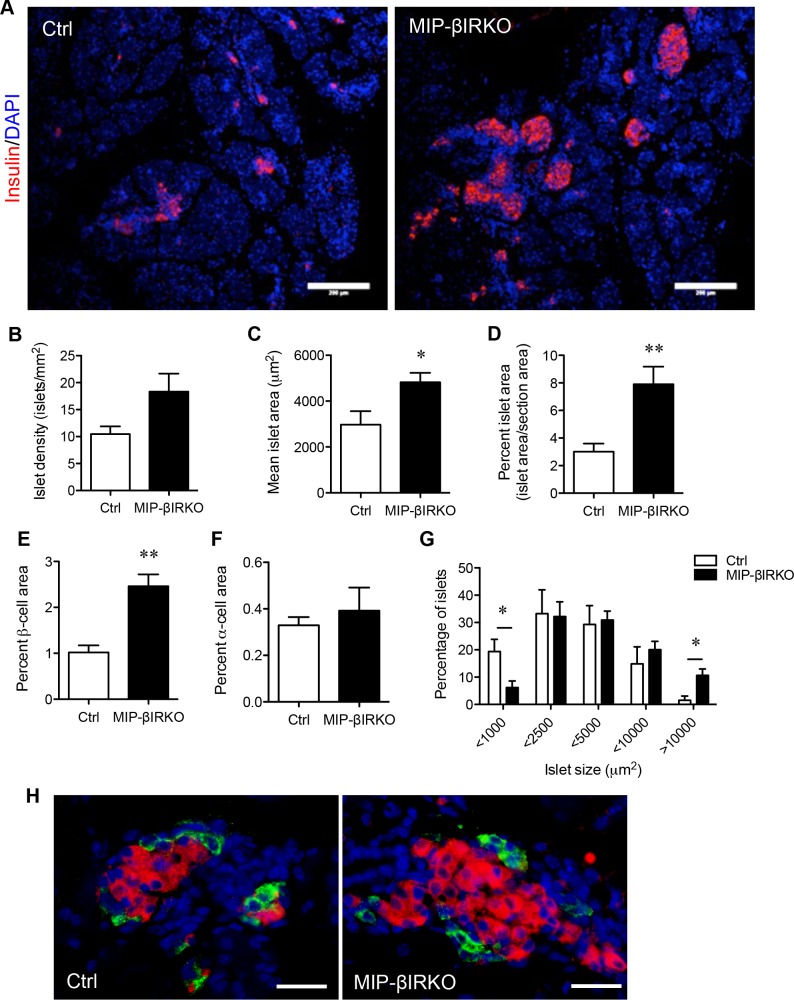
Figure 2. Fetal MIP-βIRKO mice display an islet hyperplastic growth response.
A. Representative immunofluorescence image depicting the expanded population of β-cells (red) within fetal MIP-βIRKO pancreata compared to controls. Scale bar: 200 μm. Morphometric analysis of B. islet density (islets/mm2), C. mean islet area, D. percent islet area, E. percent β-cell area, and F. percent α-cell area relative to whole pancreatic section area. G. Quantification of different islet sizes. White bars, control group; black bars, MIP-βIRKO group. Data are expressed as means ± SEM (n = 5-6). *p < 0.05, **p < 0.01 vs. controls. H. Representative double immunofluorescence images for glucagon (green) and insulin (red) staining in the islets of control and MIP-βIRKO mice. Scale bar: 50 μm. Nuclei were labeled with DAPI (blue).

