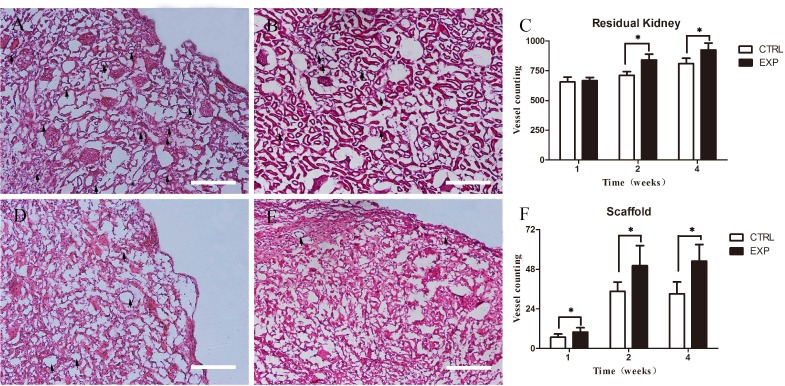
Figure 6. Average microvessel density in residual renal parenchyma and scaffold.
Residual renal parenchyma in experiment group A. show more vessels than in control group B. in week 2. Difference results showed in C. (P < 0.05). And the scaffolds in experiment group D. show higher aMVD than the control group E. Difference results showed in F. (P < 0.05). Scale bars = 50μm.

