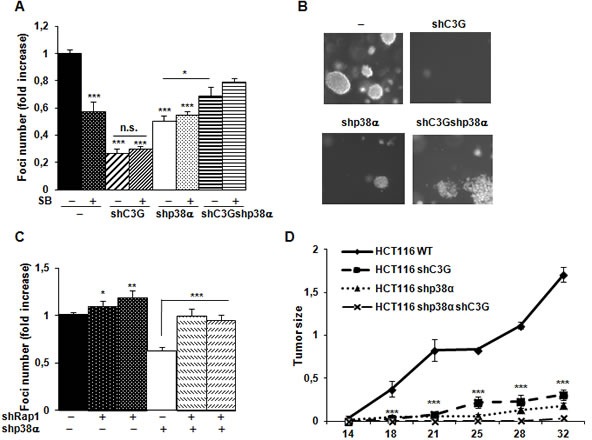
Figure 7. C3G and p38α MAPK promote tumor growth of HCT116 cells, while Rap1 does not.

HCT116 cells (non-silenced (−) and p38α knock-down (shp38α); with (shC3G) or without C3G knock-down; with (shRap1(1) and shRap1(2)) or without Rap1 knock-down) were used. A. and C. Anchorage independent growth of HCT116 cells at 14 days, in the absence or presence of SB203580 (10μM), as indicated. Histograms show the mean value ± S.E.M. of the foci number expressed as the fold increase of non-silenced cells (n = 4). *p < 0.05, **p < 0.01, ***p < 0.001 as compared with non-silenced cells, or as indicated. B. Representative images of individual foci. D. Xenograft assay. Immunodeficient mice were injected subcutaneously with HCT116 cells. Tumor size was calculated by the formula ((L/2)x(W/2))xπ, where L and W are the longest and the shortest diameter in centimeters, respectively. Graphs show the mean value ± S.E.M. of tumor size at the indicated time points (n = 6). ***p < 0.001 versus non-silenced cells.
