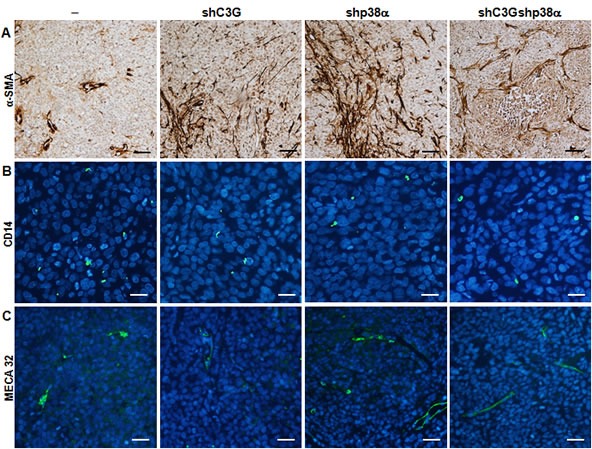
Figure 9. Analysis of infiltrated cells in tumors derived from C3G, p38α and C3G-p38α knock-down HCT116 cells.

End point tumors generated from HCT116 cells (non-silenced (−) and p38α knock-down (shp38α); with (shC3G) or without C3G knock-down) were analyzed. A. αSMA (brown), B. CD14 (green) and C. MECA32 (green) staining using specific antibodies. Scale bars: αSMA 50μM; CD14 20μM; MECA32 30μM.
