
Figure 2. Fold change in DLC1, DLC2, and DLC3 expression between tumor and adjacent control tissue.
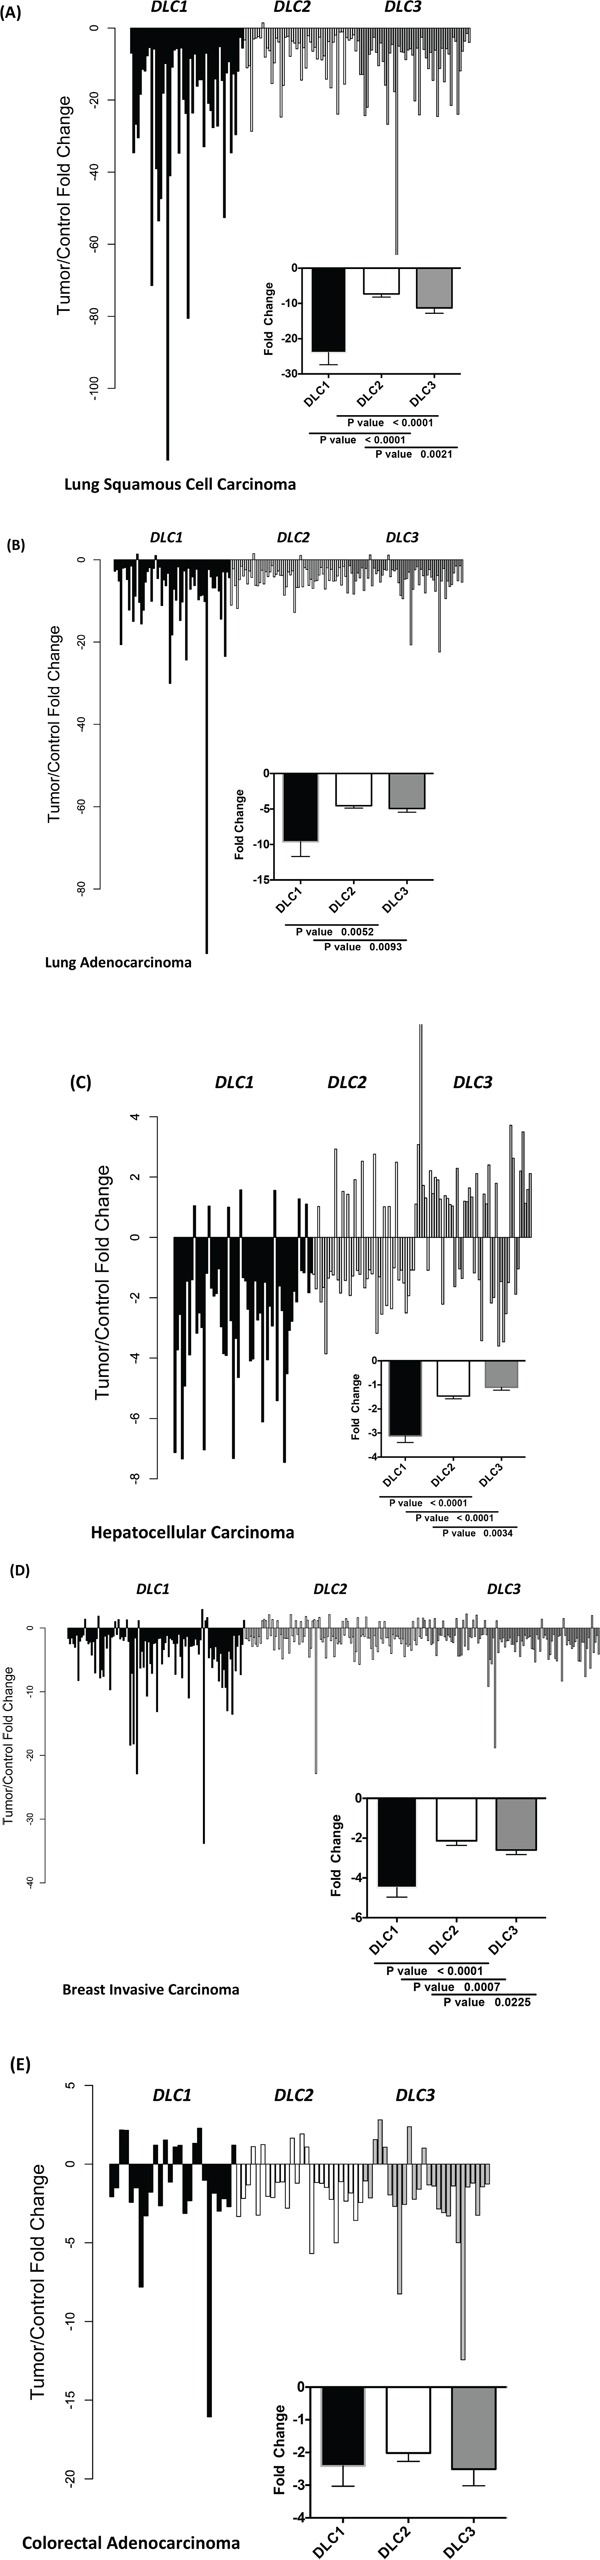
The fold change of DLC1, DLC2 and DLC3 RNA-Seq Version 2 values from individual paired control to tumor of the TCGA dataset are plotted for lung squamous cell carcinoma A., lung adenocarcinoma B., hepatocellular carcinoma C., breast cancer D. and colorectal adenocarcinoma E.