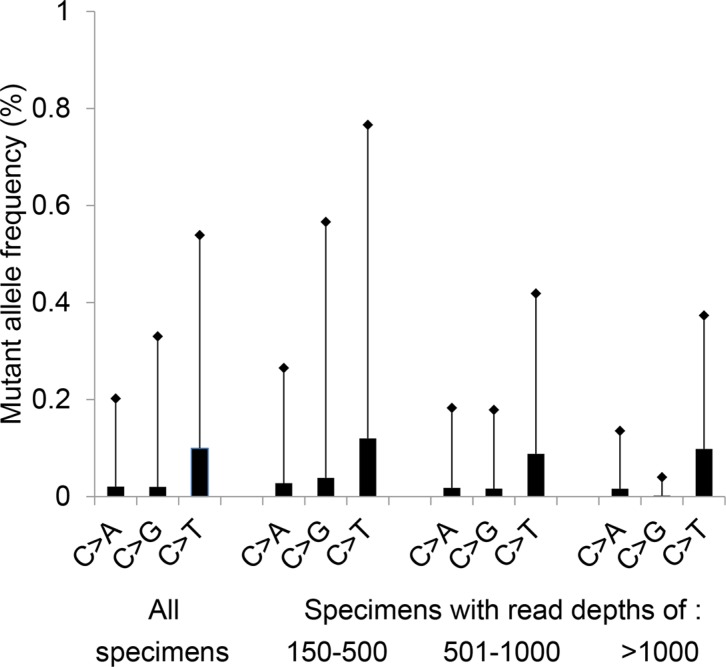
Figure 1. Background noise at EGFR c.2369C.
Mean plus 3 standard deviations (SD) of the variant frequency is plotted for a total of 179 specimens (Total); this includes 53 specimens with a read depth of 150-500 reads, 89 specimens with 501-1000 reads, and 37 specimens with more than 1,000 reads. All specimens contained an activating KRAS mutation at codons 12, 13, 61 or 146. The c.2369C > T change results in the p.T790M mutation.

