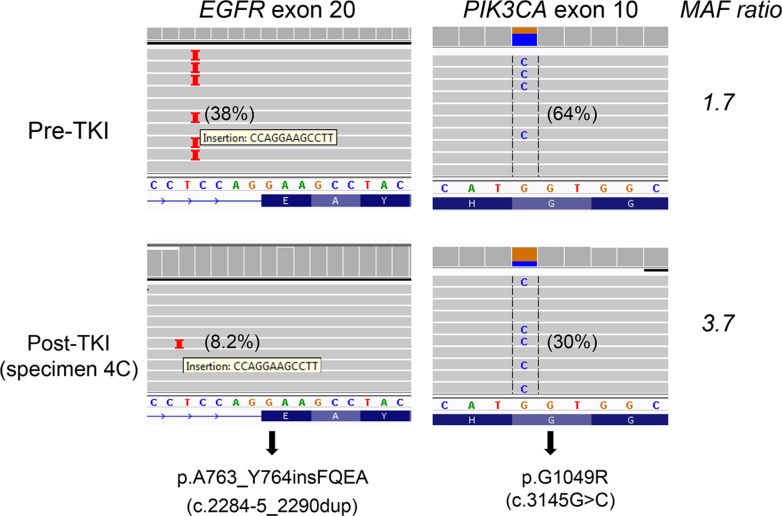
Figure 3. PIK3CA p.G1049R and EGFR p.A763_Y764insFQEA mutations in both pre-TKI (upper panel) and post-TKI (lower panel) specimens.
A 64% PIK3CA p.G1049R in the pre-TKI specimen (upper panel) suggests mutant allele-specific imbalance, which was confirmed by SNP array (Supplementary Figure S4). PIK3CA/EGFR p.A763_Y764insFQEA mutant allele ratio increased from 1.7 in the pre-TKI specimen to 2.1 (specimen 4A), 3.7 (specimen 4C) and 3.4 (pericardial effusion with small cell carcinoma) in post-TKI specimens. Repeated NGS showed PIK3CA/EGFR p.A763_Y764insFQEA mutant allele ratio was 1.6 in the pre-TKI specimen and 3.9 in post-TKI specimen 4C. Percentage in the parentheses indicates mutant allele frequency.

