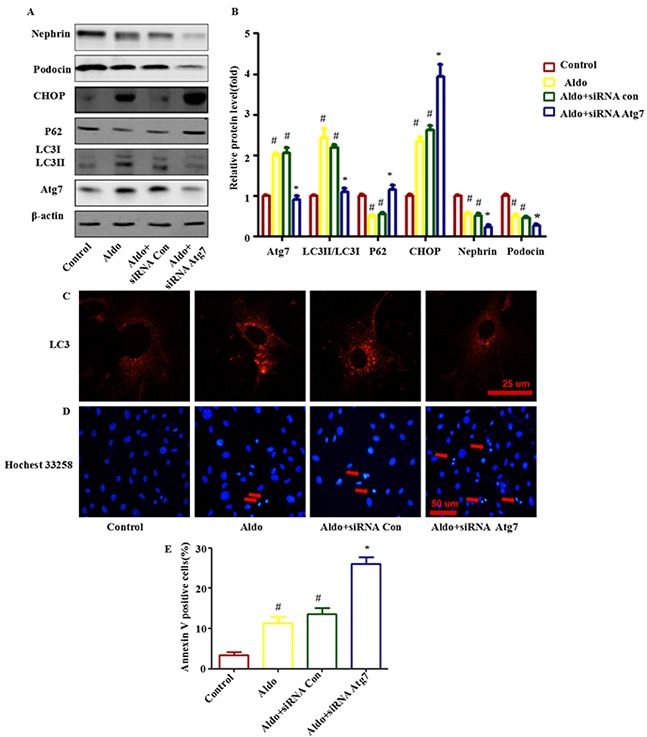
Figure 3. Knocking down Atg7 worsens Aldo-induced ER stress and podocyte injury.

A. Western blot analysis revealed the expression of LC3II/LC3I, Atg7, p62, CHOP, Nephrin, Podocin, and β-actin proteins in podocytes after treatment without or with 10-7M Aldo for various time periods, as indicated. B. Graphical presentation indicates the relative abundance levels of LC3II/LC3I, Atg7, p62, CHOP, Nephrin and Podocin after normalization with β-actin. C. Immunofluorescence staining for LC3 in podocytes after various treatments, as indicated. Scale bar=25 μm.D. Hochest33258 staining in podocytes after various treatments, as indicated. The red arrow indicates apoptosis-induced chromatin condensation and fragmentation. Scale bar=50 μm. E. After the various indicated treatments, podocytes were stained with Annexin V and PI and then analyzed by flow cytometry. Quantification of apoptotic cells by flow cytometry. Results (means±SEM) of 3 series of experiments. #P<0.05 vs. normal control, *P<0.05 vs. Aldo alone or Aldo+siRNA Control.
