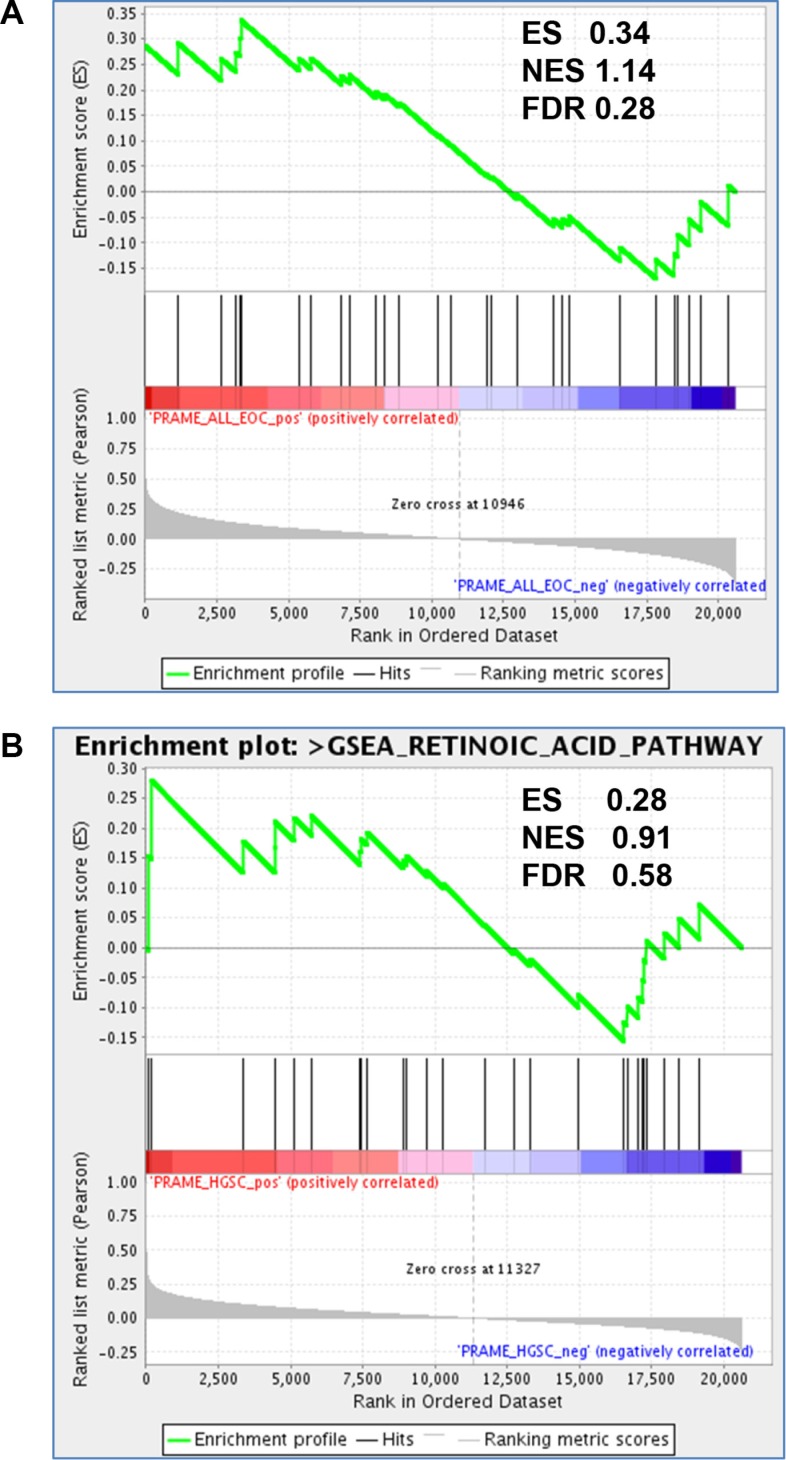
Figure 10. PRAME expression and RA pathway signatures in EOC.
GSEA analysis of enrichment of RA pathway genes (n = 30) as a function of PRAME expression in (A) EOC (N = 285) and (B) HGSC (N = 218), using Affymetrix expression data from [50]. Enrichment score (ES), normalized enrichment score (NES), and false discovery rate q values (FDR) are shown. Significant enrichment of RA pathway genes with PRAME expression was not observed.

