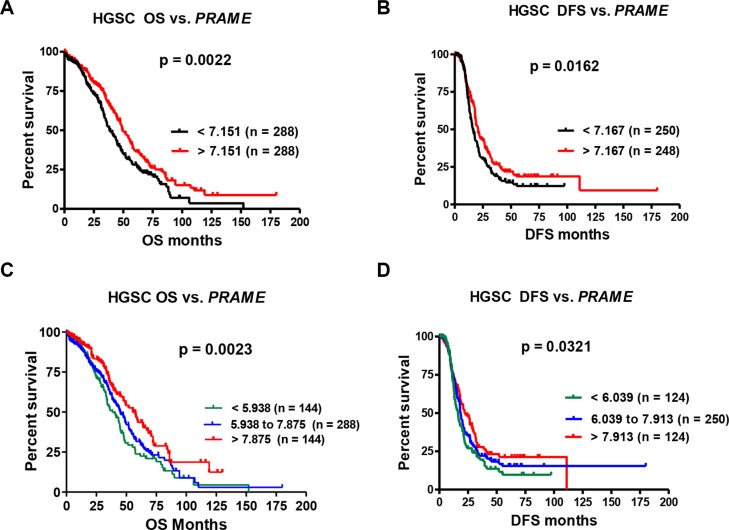
Figure 2. PRAME mRNA expression and HGSC patient survival.
(A) Overall survival (OS) and (B) Disease-free survival (DFS) of HGSC patients vs. PRAME expression, dichotomized at the median expression value. (C) OS and (D) DFS of HGSC patients vs. PRAME expression tertiles. PRAME expression was measured by Affymetrix U133 microarray; data were obtained for TCGA HGSC from cBioPortal. Logrank test p-values for two group comparison (A–B) or three-group trends (C–D) are shown.

