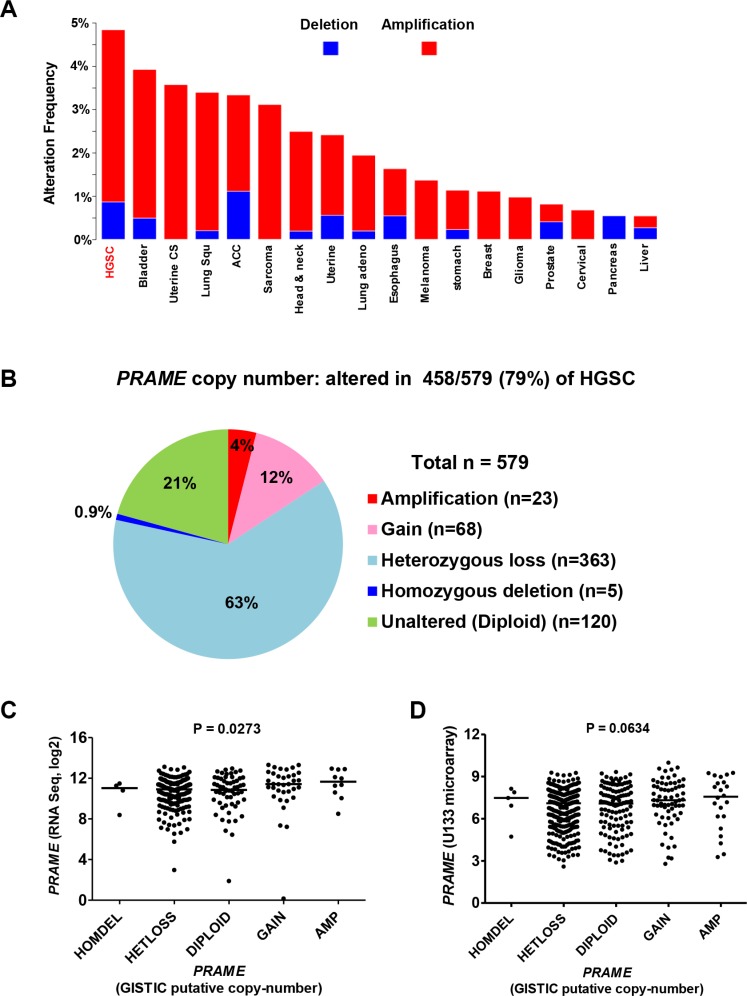
Figure 3. PRAME copy number and mRNA expression in HGSC.
TCGA data were obtained from cBioPortal [36]. (A) PRAME CNA (deletions-blue; amplifications-red) in different TCGA tumor types. The PRAME locus is at 22q11.22. (B) PRAME copy number data for HGSC (n = 579). (C) PRAME mRNA expression (RNAseq) and PRAME copy number in HGSC (N = 300). (D) PRAME mRNA expression (Affymetrix U133 microarray) and PRAME copy number in HGSC (N = 556). In C-D, Kruskal-Wallace p-values are shown.

