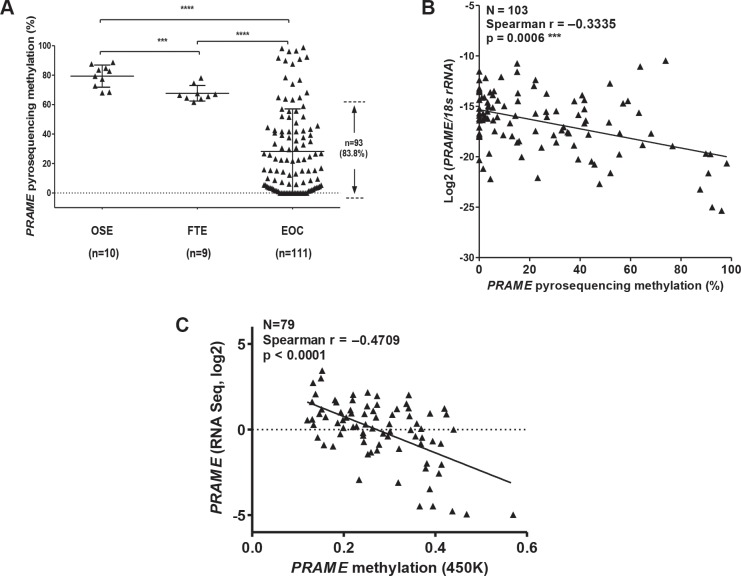
Figure 5. Sodium bisulfite pyrosequencing of PRAME 5′ region and PRAME mRNA expression.
(A) Pyrosequencing methylation data for three CpGs (averaged) (see blue rectangle in Figure 4A) in OSE, FTE, and EOC. The proportion of EOC with PRAME methylation lower than all OSE and FTE samples is indicated. The two-tailed Mann-Whitney test p-value is indicated (***P < 0.001; ****P < 0.0001). (B) Association of PRAME methylation and expression. PRAME mRNA expression was measured by RT-qPCR and was normalized to 18s rRNA expression. PRAME promoter methylation was measured by pyrosequencing. Spearman test results (two-tailed) are shown. (C) PRAME methylation and mRNA expression in ICGC data. Methylation was determined in primary HGSC tumors using Illumina 450 K arrays and PRAME mRNA expression was determined using RNAseq. The CpG sites measured by this assay are indicated by stars in Figure 4A. Spearman test results (two-tailed) are shown.

