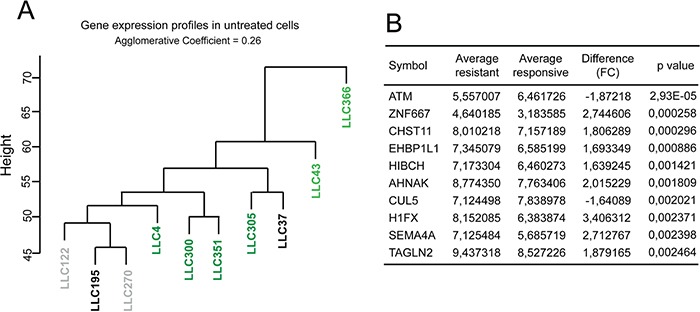
Figure 6. ATM and the resistance to 2cPE.

A. Hierarchical clustering of gene expression profiles of untreated B-CLL cells from the different patients. A colour code was used to represent the apoptotic responsiveness to 2cPE and bortezomib of the different B-CLL cells. Apoptosis >75% (dark green); apoptosis between 46-74% (light green) apoptosis <20% (grey) apoptosis <10% (black). B. 10 top DEGs in untreated B-CLL cells from patients LLC122, LLC195 and LLC270 compared to the untreated leukemia cells, responsive to 2cPE, from all other patients. DEGs were ranked for P value.
