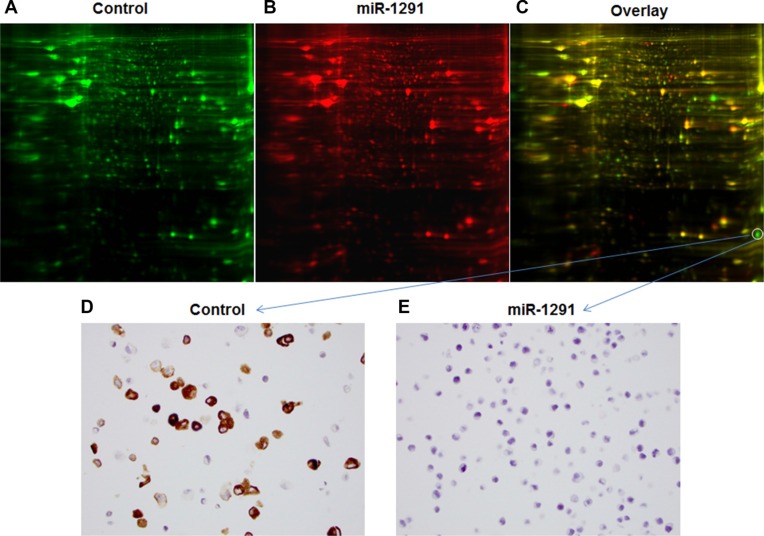
Figure 5. Difference in global protein expression profiles between miR-1291-expressing and control PANC-1 cells.
(A–C) 2D-DIGE images of proteins in the control and miR-1291-expression PANC-1 cells labeled with green and red fluorescent dye, respectively, and the overlaid graph indicating the difference in the abundance of proteins. The protein downregulated in miR-1291-expressing PANC-1 cells to the greatest degree was identified as AGR2. (D, E) Immunocytochemistry analysis confirmed the sharp downregulation of AGR2 (brown staining) in miR-1291-expressing PANC-1 cells (400 ×).

