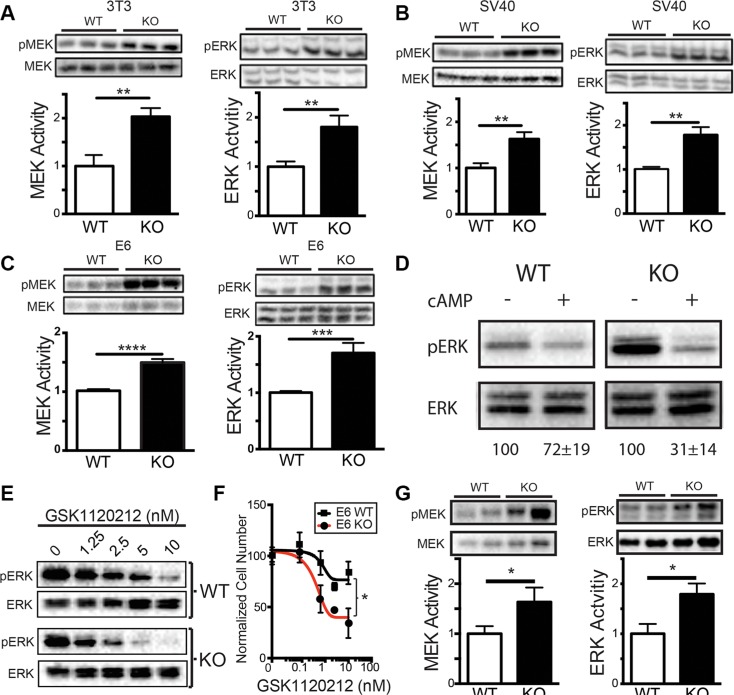
Figure 4. Loss of sAC activity leads to MAPK pathway activation.
(A–C) MAPK activity in mouse cells following serum starvation. Western blot and quantitation (normalized to WT) of pMEK/MEK (MEK Activity, 43 kDa, left panels) and pERK/ERK (ERK Activity, 44/42 kDa, right panels) in WT (white bars) and sAC KO (black bars) (A) 3T3 MEFs, (B) SV40 MEFs, and (C) E6 MEFs. For A-C, N = 3. (D) MAPK activity in 3T3 MEFs following the addition of Sp-8-CPT-cAMPs (+, 500 μM) or DMSO control (−) for 15 minutes. Data is a Western blot of pERK/ERK (44/42 kDa). Representative figure of an experiment performed in triplicate. Below Western blot is the average band quantitation (across all experiments) relative to DMSO control (set to 100%). (E) Western analysis of pERK (44/42 kDa) and total ERK (44/42 kDa) in WT (WT, top) and sAC KO (KO, bottom) MEFs following incubation for 1 hour with the MEK inhibitor GSK1120212 at the concentration indicated. Representative figure of an experiment performed three times. (F) Normalized cell number of WT (black lines, squares) and sAC KO (red lines, circles) MEFs following 72 hours of treatment with GSK1120212 at the concentrations indicated (N = 4). (G) Western blot and quantitation (normalized to WT) of pMEK/MEK (MEK Activity, 43 kDa, left panels) and pERK/ERK (ERK Activity, 44/42 kDa, right panels) in WT (white bars) and sAC KO (black bars) mouse epidermis. N = 3 (A–C, G) Student's t-test. error ± SEM. (F) Repeated measures ANOVA with post-hoc Sidak. Bracket indicates comparison of treatment groups. *P < 0.05, **P < 0.01, ***P < 0.001, ****P < 0.0001.

