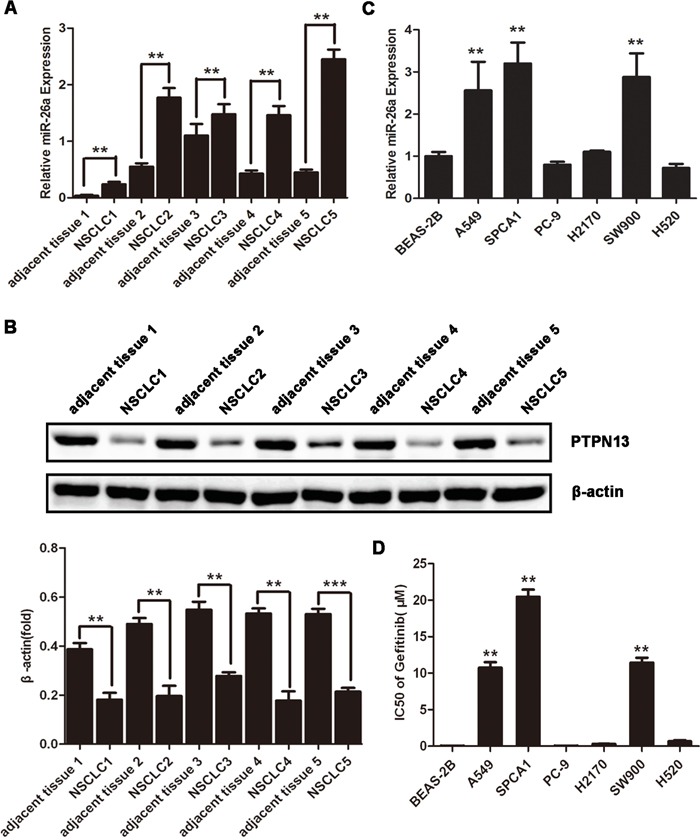
Figure 1. miR-26a is highly expressed in TKI-resistant NSCLC cells.

A. qRT-PCR assays of NSCLC samples and paired adjacent normal tissues. Data are represented as the mean ± SD of three replicates. **P<0.01 vs adjacent tissue. B. Western blot assays of NSCLC samples and the paired adjacent normal tissues using anti-PTPN13 antibody. Data are representative of 3 independent experiments. All the protein levels measured with densitometry and normalized to β-actin. Each bar represents the mean±SD from three experiments. **p<0.01vs control. C. qRT-PCR assays of the indicated human NSCLC cell lines or immortalized bronchial epithelial cell line, BEAS-2B. Data are represented as the mean ± SD of three replicates. *P<0.05, **P<0.01 vs BEAS-2B cells. D. NSCLC or immortalized bronchial epithelial cell lines were treated with or without gefitinib, and the doses of gefitinib that suppress cell growth by 50% (IC50) in MTT assays were plotted. Data are represented as the mean ± SD of three replicates. **P<0.01 vs BEAS-2B cells.
