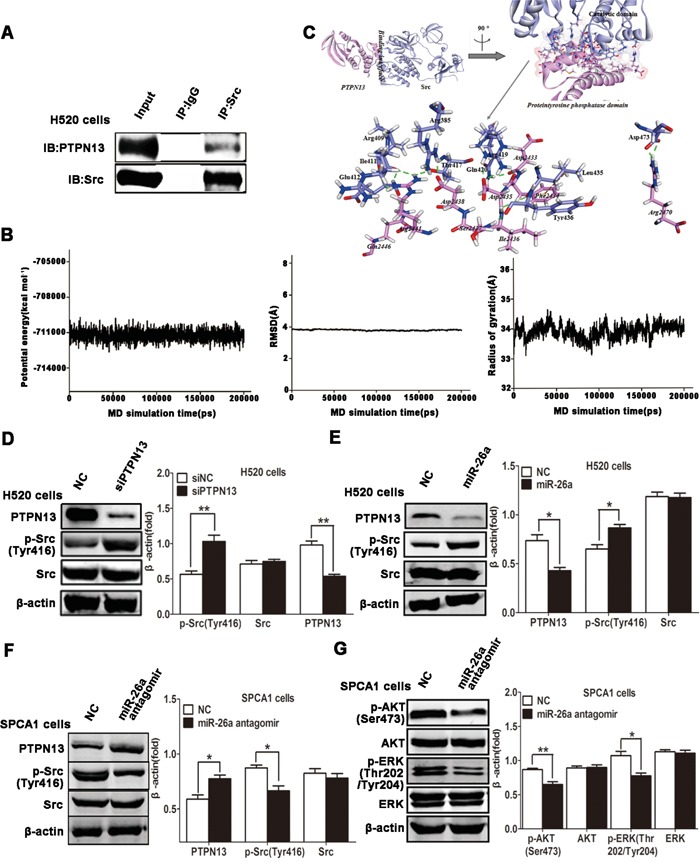
Figure 4. miR-26a/PTPN13 regulates EGFR/Src signaling.

A. Immunoprecipitation (IP) of PTPN13 with anti-Src antibody in H520 cells. The total protein for IP is 500μg, and the input protein is 30μg. B. The time-evolution potential energy, backbone-atom RMSD and radius of gyration for the PTPN13-SrcpTyr416 complex. C. The propeller structure and key residues within the binding interface of PTPN13-SrcpTyr416 complex. The Connolly surface of binding interface is colored by electrostatic potential. The key residues of PTPN13 and SrcpTyr416 are represented by stick models. The C atoms are colored in cyan and pink for PTPN13 and SrcpTyr416, and the H, N and O atoms are colored in white, blue and red, respectively. H-bonds and hydrophobic-interactions are labeled in dashed green and brown lines, respectively. D. Western blot assays of H520 cells after treatment with EGF (10 ng/ml) and transfected with control siRNA and PTPN13 siRNA. E. Western blot assays of H520 cells after treatment with EGF (10 ng/ml) and transfected with control or miR-26a mimics. F, G. Western blot assays of SPCA1 cells after treatment with EGF (10 ng/ml) and transfected with control or miR-26a antagomirs. In western blot, data are representative of 3 independent experiments. All the protein levels measured with densitometry and normalized to β-actin. Each bar represents the mean±SD from three experiments.*p<0.05, **p<0.01vs control group.
