
Figure 1. Different morphology of each cell line in 2D and 3D culture.
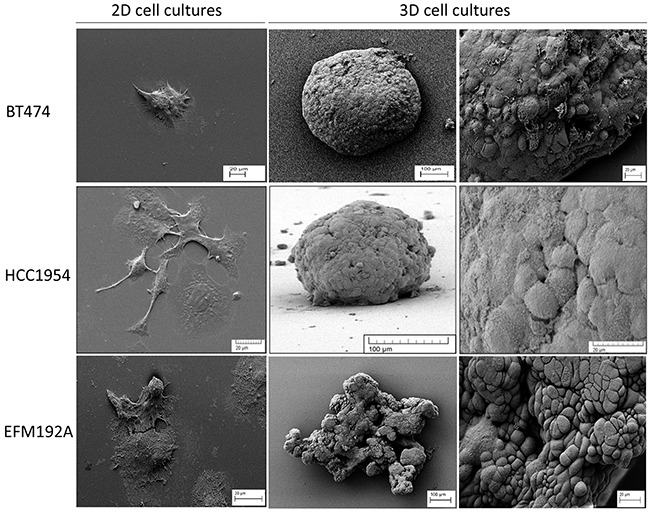
SEM images show how the morphology of cells differs substantially when grown in 2D compared to 3D cultured cells. For all lines, cells grew attached to the cover-slip when using standard culture methods. Both BT474 and HCC1954 cells form a tightly packed spheroid when grown in 3D, while EFM192A cells form a less organised 3D structure when cultured under the same conditions. Scale bars are shown on all images.