
Figure 2. 2D compared to 3D cell viability.
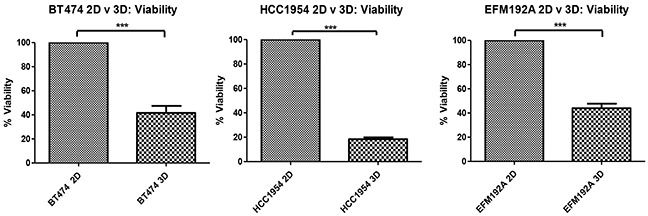
Starting with the same cell numbers and time of culture, cells cultured in 3D have significantly decreased viability compared to those cultured as 2D monolayers. Graphs represent triplicate biological repeats and are displayed as mean ± SEM, where ***p < 0.001.