
Figure 4. Immunoblots of pAkt, Akt, pErk and Erk expression in 2D and 3D cultures.
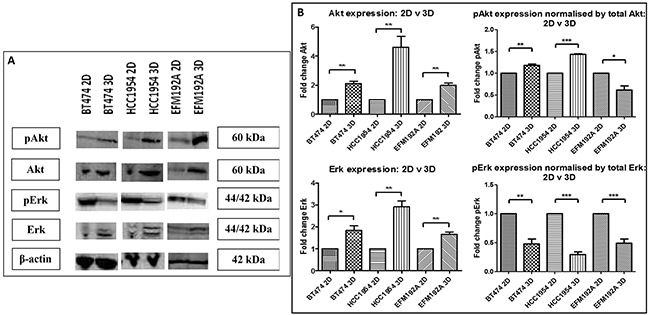
A. Akt, pAkt and Erk level were all significantly higher in 3D cultures of each of the cell lines compared to their 2D counterparts, while pErk levels were significantly reduced. B. Densitometry of respective immunoblots. Graphs represent triplicate biological repeats and are displayed as mean ± SEM, where *p < 0.05; **p < 0.01.