
Figure 6. Immunoblots of drug transporter expression in 3D compared to 2D cultures.
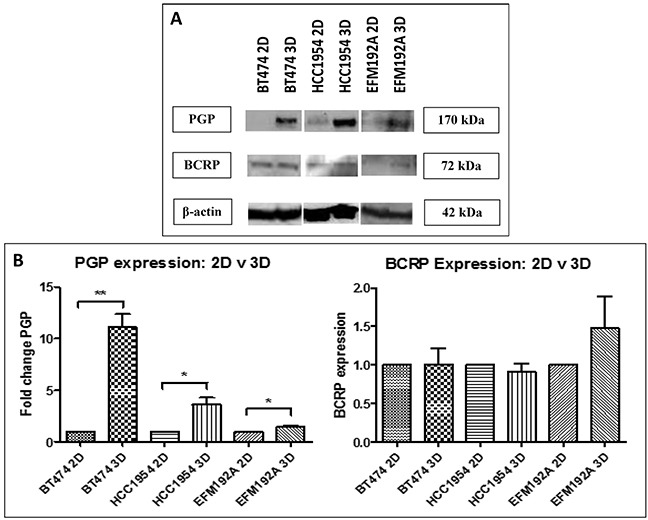
A. P-glycoprotein (PGP) level were increased in 3D cultures of all three cell lines, but breast cancer resistance protein (BCRP) levels were not consistently changed between 3D and 2D. B. Densitometry of respective immunoblots. Graphs represent triplicate biological repeats and are displayed as mean ± SEM, where *p < 0.05; **p < 0.01.