
Figure 2. Evaluation of the prognostic value of the extracted 4-miRNA signature in an age- and sex-matched subgroup of standard-of-care treated patients of the TCGA GBM dataset.
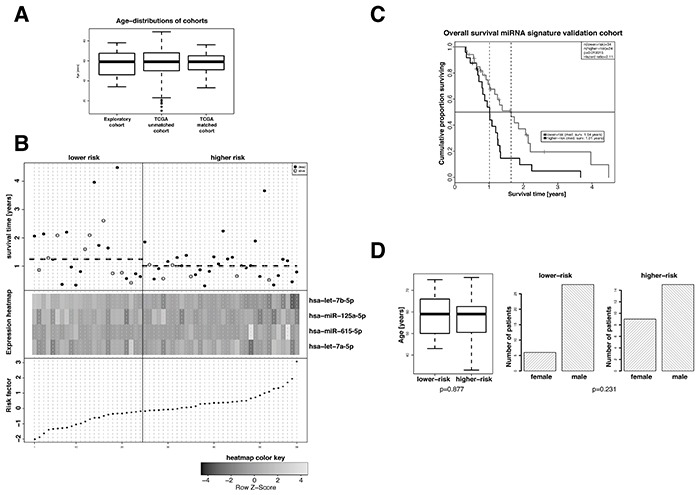
A. Age distribution in the exploratory cohort and the TCGA GBM cohort before and after age matching. B. Overall survival (top panel), hierarchical cluster heat map of miRNA expression levels (middle panel), and risk factors for patients of the age- and sex-matched TCGA GBM cohort. The median risk factor value was used to classify high-risk and low-risk patients. miRNAs hsa-let-7a-5p, hsa-let-7b-5p and hsa-miR-125a-5p in patients of the higher-risk group show a slight tendency towards lower expression and that of hsa-miR-615-5p a slight tendency towards higher expression. C. Kaplan-Meier overall survival analyses of high-risk and low-risk standard-of-care treated patients of the age- and sex-matched TCGA GBM cohort. Classification of high-risk and low-risk patients was performed on the basis of the risk factors calculated from the cox-proportional hazard coefficients (Table 2) and the miRNA expression levels. Hazard ratios and p-values were calculated by log-rank test. D. Distribution of age (left panel) and sex (right panel) in high-risk and low-risk patients of the age- and sex-matched TCGA GBM cohort. Student's t-test and Fisher's exact test were employed for statistical comparison as depicted.