
Figure 3. Heatmaps of the gene expressions correlating with the 4 miRNAs hsa-let-7b-5p, hsa-miR-125a-5p, hsa-miR-615-5p and hsa-let-7a-5p the age- and sex-matched TCGA GBM cohort of standard-of-care treated patients.
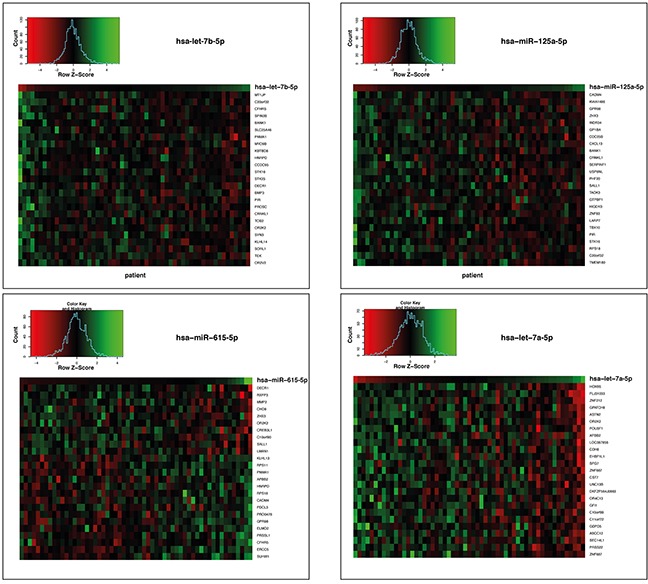
Genes whose expression levels statistically significantly correlated (p < 0.01) with the respective miRNA expression levels are shown. Every column represents an individual patient. Data are ordered from left to right by increasing miRNA expression.