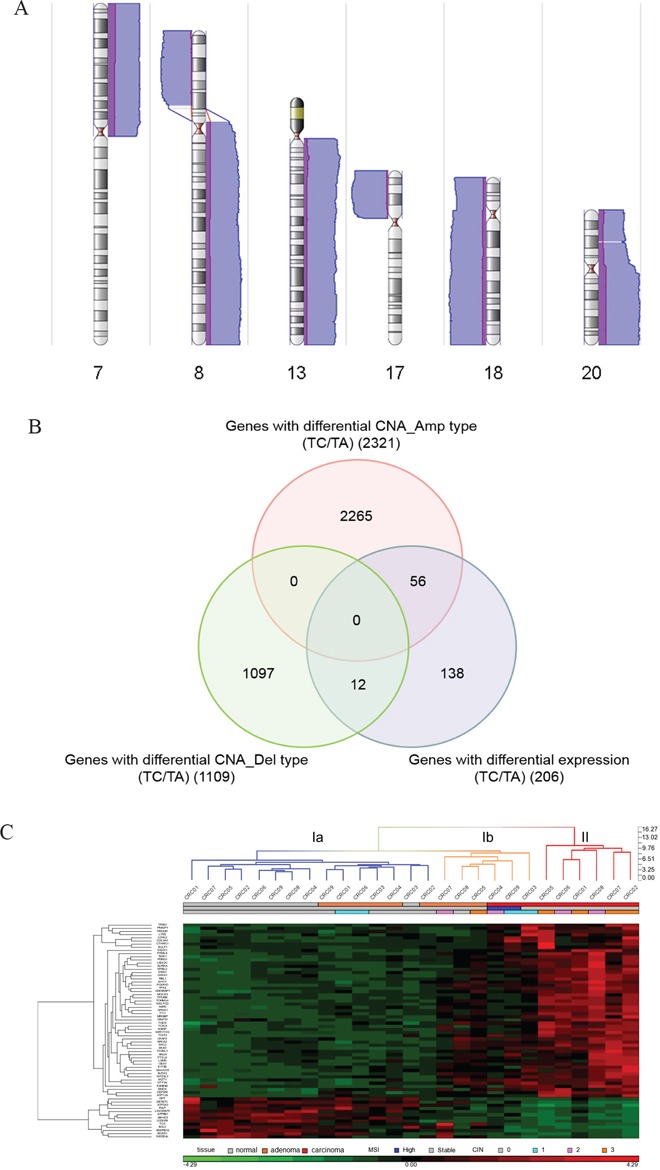
Figure 1. Identification of malignant transformation-related genes.

A. Genomic regions with differential copy number alterations in carcinoma samples compared to polyp samples. Purple bars indicate CNAs detected in polyp samples and blue bars indicate CNAs detected in carcinoma samples. Bars on the right side represent amplification-type CNAs while bars on the left side represent deletion-type CNAs. The heights of the bars indicate the numbers of samples with CNAs in that region. Chromosome numbers are indicated at the bottom of each karyogram. B. Venn diagram of genes with differential expression and genes with differential CNAs in carcinoma samples. The number of genes in each list is shown in parentheses. C. Hierarchical clustering of the tissue samples and the 68 candidate genes. The tissue samples include nine carcinomas, nine paired polyps, and nine paired non-neoplastic colon tissues. mRNA expression levels are shifted to a mean of zero and scaled to a deviation of one, with green representing the lowest level and red representing the highest level. The tissue group, MSI status, and CIN level of each sample is indicated under the sample column. Blue dendrogram columns belong to cluster Ia, orange to cluster Ib, and red to cluster II.
