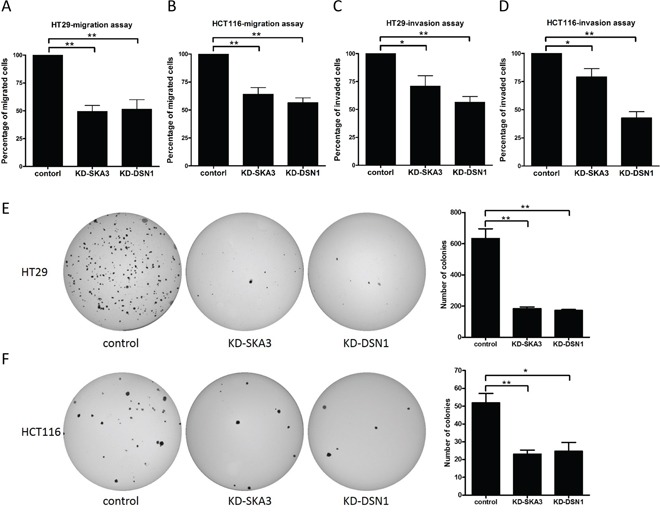
Figure 7. Knockdown of SKA3 or DSN1 inhibits migration, invasion, and anchorage-independent growth.

Transwell migration, invasion, and soft agar colony assays were conducted with HT29 and HCT116 cells transfected with control siRNA or target siRNA. Knockdown of SKA3 or DSN1 inhibited cell migration and invasion in both cell lines A-D. Relative percentages of migrated and invaded cells are presented as mean ± SD. Depletion of SKA3 or DSN1 decreased colony formation in E. HT29 cells and F. HCT116 cells. Representative images of colony formation following each treatment are shown on the left and quantification results are shown on the right. Numbers of colonies are presented as mean ± SD. (*p<0.05; **p<0.01).
