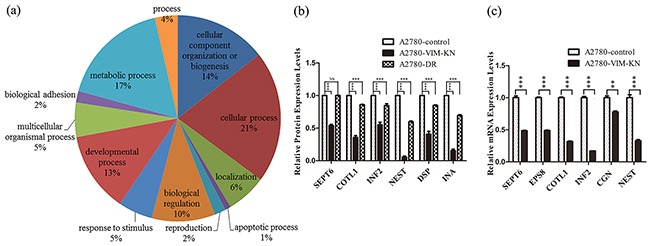
Figure 3. Analysis of differentially expressed proteins between A2780-VIM-KN and control cells.

a. Functional classification of differentially expressed proteins between A2780-VIM-KN and control cells with PANTHER (http://www.pantherdb.org). b. Graphical representation of expressions levels of selected proteins in A2780-DR, A2780-VIM-KN and control cells as determined by PRM analysis. c. Graphical representation of mRNA expressions levels of selected cell junction genes in A2780-VIM-KN and control cells. All the results show the means of three independent experiments. Error bars indicate SEM. Data were analyzed using Student's t test. *p < 0.05, **p < 0.01 and ***p < 0.001.
