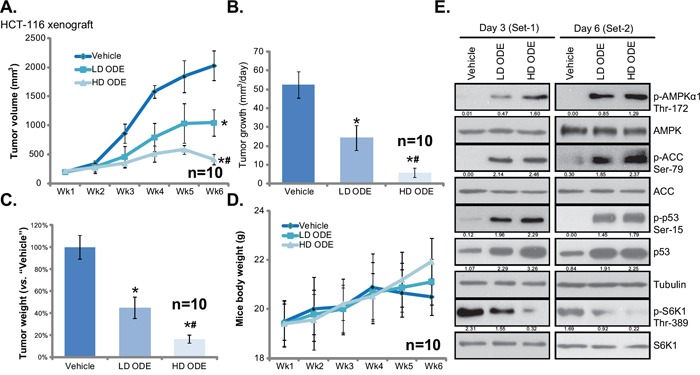
Figure 6. ODE inhibits HCT-116 xenograft growth in SCID mice.

Weekly HCT-116 xenograft tumor growth curve A. and mice body weight curve D. with indicated treatment: Saline (“Vehicle”), low-dose of ODE (0.2 g/kg, i.p., daily, “LD ODE”), high-dose of ODE (1.0 g/kg, i.p., daily, “HD ODE”), were shown (A). Tumor daily growth B. and tumor weights at week-6 C. were also presented. Three and six days after initial ODE administration, one mice per group were sacrificed, tumor tissues were removed and were subjected to Western blot assay of listed proteins E. Kinase phosphorylations and p53 expression were quantified (E). In vivo experiments were repeated twice, and similar results were obtained * p < 0.05 vs. “Vehicle” group. # p < 0.05 vs. “LD ODE” group.
