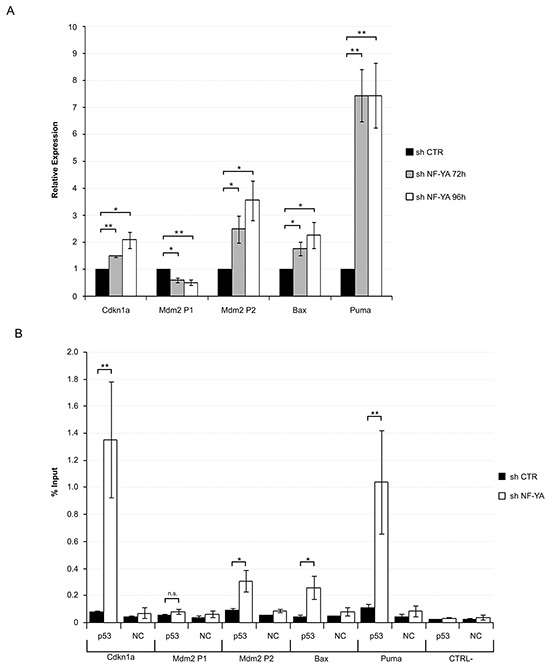
Figure 3. Activation of functionally active p53 in NF-YA-inactivated Hela cells.

A. qRT-PCR analysis of bona fide p53 target genes 72h and 96h post-infection with shCTR and shNF-YA. Amplified genes are indicated. Statistical significance was calculated with independent t-test (* p < 0.05; ** p < 0.01). B. ChIP analysis of p53 binding to the regulatory regions of Cdkn1a, Mdm2-P1, Mdm2-P2, Bax and Puma genes in shCTR and shNF-YA cells 96h after infection. CTRL- represents a CCAAT-less negative control region, localized at about 5000bp upstream of the Myc gene. The p53 enrichment was determined as percentage of IP recovery. Statistical significance was calculated with independent t-test (* p < 0.05; ** p < 0.01). Error bars indicate SEM.
