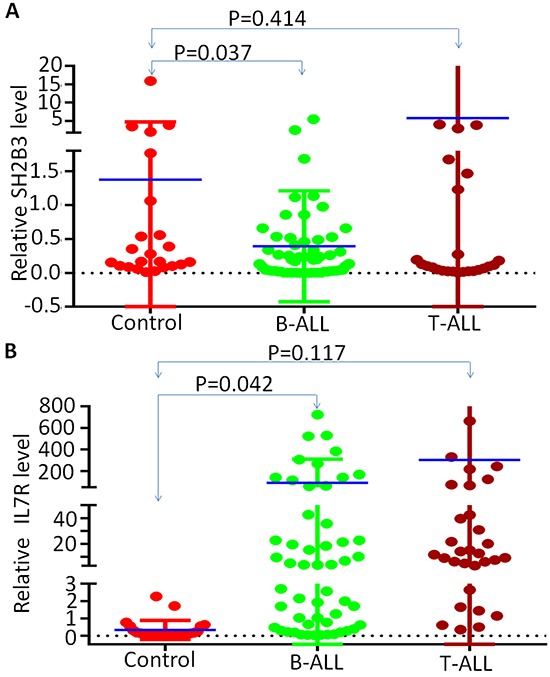
Figure 1. SH2B3 and IL7R expression in B-ALL patients.

q-PCR was performed to detect IL-7 and SH2B3 in ALL patient samples and normal BM controls. Graphed is the relative expression A. Comparison of SH2B3 expression in B-ALL and T-ALL to normal BM control; B. Comparison of IL7R expression in B-ALL and T-ALL to normal BM control. Median expression is indicated and comparisons were by Mann-Whitney U test.
